
Making analysis of snow avalanche phenomena possible!
New approaches to field observation of snow avalanches
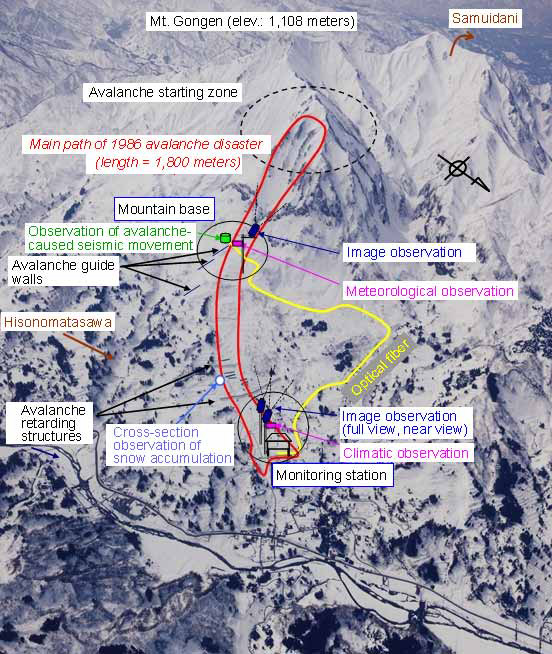 Overview of the onsite observation system, Maseguchi district |
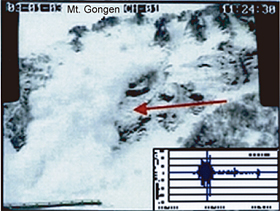 Maseguchi district: Jan. 3, 2003 (Image of full depth avalanche and avalanche-related seismic data) |
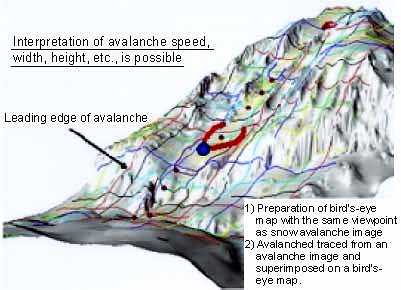 Analysis of avalanche image using airborne laser measurement data |
Of 100 snow avalanche disasters that occurred during the “heavy snowfall of 2006” (surveyed by the Sabo Department, MLIT), 28 struck villages and resulted in loss of precious lives for the first time in 20 years. Despite the fact that ascertaining actual conditions surrounding snow disasters is indispensable to study of countermeasures against them, conducting onsite field investigations is not easy due to the risk of avalanche recurrence. Moreover, there are few highly precise surveys available, as surveys are affected by changes in snow surface that are caused by snowfall and wind as well as changes in snow quality caused by melting.
Given the above, the Snow Avalanche and Landslide Research Center began recording the occurrence of snow avalanches in 1995. This effort involved making video observations of snow avalanches and collecting meteorological data on 11 avalanche-prone slopes in the Hokuriku and Tohoku regions. We later narrowed down these locations to the following current four:
- The Maseguchi district of Itoigawa City, Niigata Prefecture
- The Samuidani district of Itoigawa City, Niigata Prefecture
- The Hakuba-Happo district of Hakuba Village, Nagano Prefecture
- The Shinanodaira district of Iiyama City, Nagano Prefecture
Our observations at these locations include meteorological observation, snow cover observation, measurement of snow avalanche-caused seismic movement, and measurement of snow avalanche impact pressure.
Types video images of snow avalanche movement that are obtained from constant onsite observation of avalanches, we interpret and measure the following:
- Time of snow avalanche occurrence
- Types of snow avalanche
(loose-snow or slab, dry or wet,full depth or surface)
- Travelling path and size of snow avalanche
Traditionally, we obtained information on a snow avalanche’s path, speed, etc., by interpreting the position of the avalanche’s leading edge at time intervals and tracing its path on maps or aerial photographs. More recently, we have been attempting a new method that uses airborne laser measurement to prepare bird’s-eye maps with the same viewpoint as snow avalanche images, and that quantitatively calculates avalanche speed, width, height, and other characteristics. This new method allows us to perform fine-tuned analyses that were difficult using the traditional method. Moreover, because the method uses highly precise topographical data, we are now able to analyze the movement of snow avalanches.
Thus far, we have videoed numerous snow avalanche movements, including a large avalanche that traveled much as 2.5 kilometers downhill. We are analyzing these images by comparing them with meteorological and seismic data.
For the future, we intend to use this method to elucidate the mechanisms behind occurrence and movement of snow avalanches, many of which have remained poorly understood, and to reelect our findings on guidelines for snow avalanche countermeasures.
(Contact: Snow Avalanche and Landslide Research Center)
Predicting floods before they happen!
New flood forecasting technology that uses radar-measured rainfall
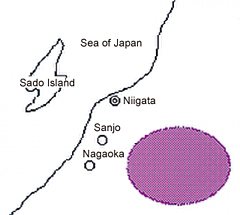 Location of basins of the Kariyata River and Ikarashi River, Niigata Prefecture Area of flooding caused by torrential rains in July 2004 |
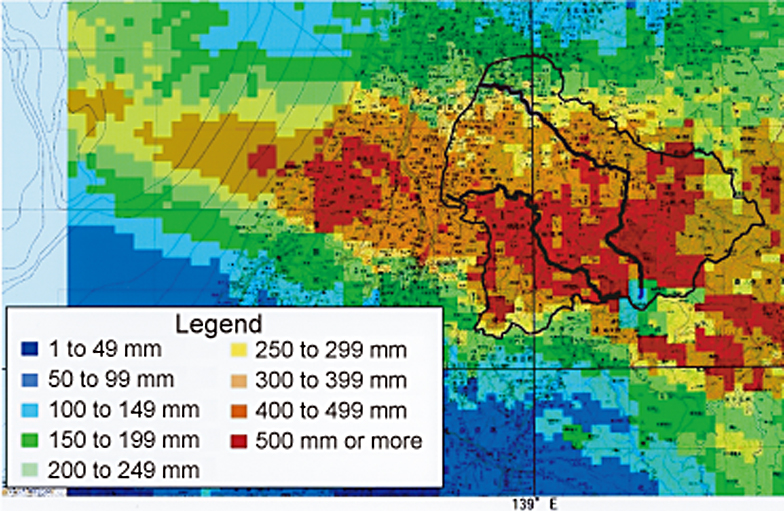 Example of 1-km mesh rainfall from radar rain gauge measurement Area around the Kariyata River (left thick line) and Ikarashi River (right thick line) basins in Niigata Prefecture, July 12 and 13, 2004. |
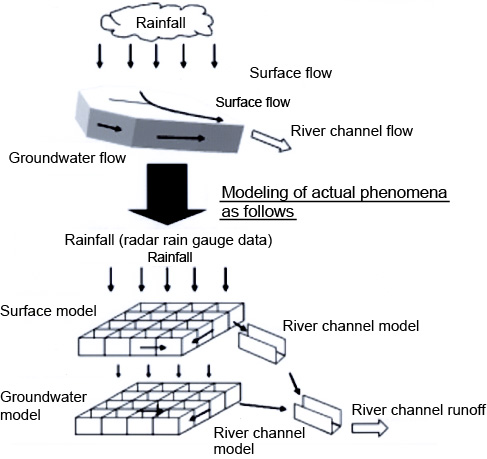 Distributed parameter-based runoff analysis model that calculates the rainfall-runoff relationship |
Flood disasters along small- and medium-scale rivers have been occurring
frequently in recent years. Accurate flood prediction in small- and medium-scale
rivers—where floods commonly occur during rainy and typhoon seasons—requires
precise observation and prediction of rainfall in the river basins. However,
it also requires a “runoff analysis model” that correlate rainfall
with river runoff exactly. The International Centre for Water Hazard and
Risk Management under the auspices of UNESCO (ICHARM) has developed a next-generation
runoff analysis model that can directly utilize observed and predicted
rainfall data with radar raingauges, and that can be applied widely to
any river basins from large- to small-scale. Some various related technologies
are combined with the new model. The details are introduced below.
Traditionally, we have made flood forecasting with rainfall data observed
with ground-based raingauges placed at the ratio of one gauge per around
50km2 on average. Although this ratio is sufficient for large rivers, such
as the Tone River and Yodo River of Japan, it is not enough to take into
account the effects of localized torrential rain in small- and medium-scale
rivers. To cope with this problem, we applied the combination of radar-derived
rainfall data available all over Japan with 1km-mesh resolution and a distributed-parameter
hydrologic model which can incorporate such mesh-based rainfall data directly..
This approach prevents us from overlooking the impact of localized torrential
rains. Moreover, the model takes into account basin-wide wetness (soil
moisture, groundwater level, etc.). These characteristics lead to the improvement
of the accuracy of flood forecasting. In addition, we have made innovations
toward building a model that can even be used in river basins for which
past hydrological observation materials are lacking. Such innovations enable
us to apply this runoff model to not only large-scale but also small- and
medium-scale river basins as well as sub-basins in the upper reaches and
tributaries.
We have also implemented a few more new practical innovations to improve the accuracy of water-level predictions in downstreams affected by the downstream condition such as tidal waves, dam operations, etc. and to modifying calculational results using differences between real-time observed and predicted values. User-friendly graphical interfaces are also implemented.
Given these characteristics, our new flood prediction technology can contribute not only to flood forecasting in various scale of rivers but also to more efficiently integrated management of multiple dams clusters, and to sharing flood information for the entire river basin from its upstream to downstream and its main stream to tributaries.
(Contact: Hydrologic Engineering Research Team, ICHARM)