High-frequency Topographic Survey for Elucidating Sediment Transport Processes at a River Mouth

Figure 1 Location of the study site
(click to enlarge)

Figure 2 Topographic change
between Apr. 12 and Jun. 6
in snow melt season
(Contour lines; elevation on Apr. 12)
(click to enlarge)

Figure 3 Topographic change
between Sep. 7 and 20
(Typhoon No.18 passed on Sep. 16.
Contour lines; elevation on Sep. 7)
(click to enlarge)
1. Importance of the frequent topographic survey for elucidating the sediment transport processes at a river mouth
To examine measures against coastal erosion around a river mouth, it is necessary to clarify the sediment runoff from the river to the ocean and its transport processes in the nearshore region. The sediment with relatively large grain size, which forms sand-covered shorelines, initially deposits at the river mouth, and then, a portion of it is transported to the nearshore region by wave action or wave-induced currents. Because river discharge and wave conditions, such as wave height, period and direction, are continually changing, the bed-form variation at the river mouth should be frequently investigated to clarify the sediment runoff from the river and the sediment transport processes and rate.
2. Results of high-frequency survey at a river mouth
The Port and Coast Research Team is trying to measure the sediment discharge from the Mu River in Hokkaido, Northern Japan (Figure 1), and its transport processes at the river mouth by conducting high-frequency topographic survey. The mouth of the Mu River has retreated by more than 300m since 1970s, resulting in the disappearance of the tidal flat. Surveys were conducted on 17 times from Apr. 2013 to Mar. 2014. The survey range perpendicular to the shore was 1.0km from the shoreline and in the range parallel to the shore it was 2.0km. The river discharge data was acquired at the Mukawa hydrological observation station at 2.6km upstream from the river mouth. The wave data was acquired at the Samani wave observation station at about 100km southeast of the river mouth. In the snowmelt season, the river discharge increased by up to 400m³/s and about 4.6×10⁴m³ of fine sediment deposited at the river mouth (Figure 2). After the snowmelt season, scant sediment accumulated at the river mouth, because the river discharge significantly decreased. A sandbar evolved from left bank side, due to alongshore currents flowing from the east. In September, the river discharge rapidly increased by up to 900m³/s due to heavy rainfall brought by a typhoon. About 3.0×10⁴m³ of sediment was transported more than 300m offshore during the flood event (Figure 3). The sediment that was deposited offshore was transported toward the nearshore region by wave action in a storm event after the typhoon passed.
3. Future Plan
In the future, the relation between river discharge and sediment supply to the ocean, and the relation among wave conditions, sediment transport rate and the processes will be clarified.
(Contact: Port and Coast Research Team, Civil Engineering Research Institute for Cold Region (CERI))
REVIEW OF SNOW-CONTROL FACILITIES BY WIND TUNNEL EXPERIMENTS USING A SCALE MODEL

Figure 1 Wind tunnel
experiment apparatus
(click to enlarge)

Photo 1 Blower snow fence model
(blockage ratios, from left:
0%, 50%, 100%)
(click to enlarge)

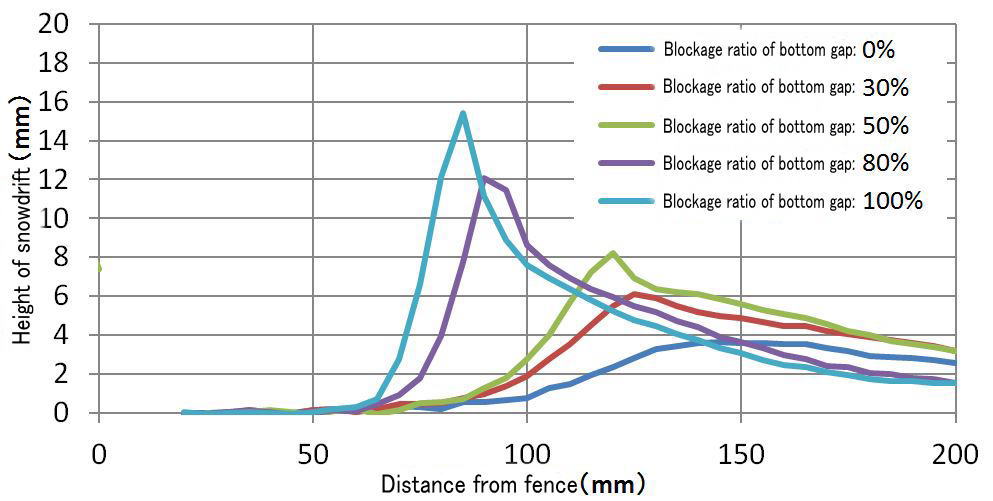
Figure 2 Height of snowdrift
(click to enlarge)

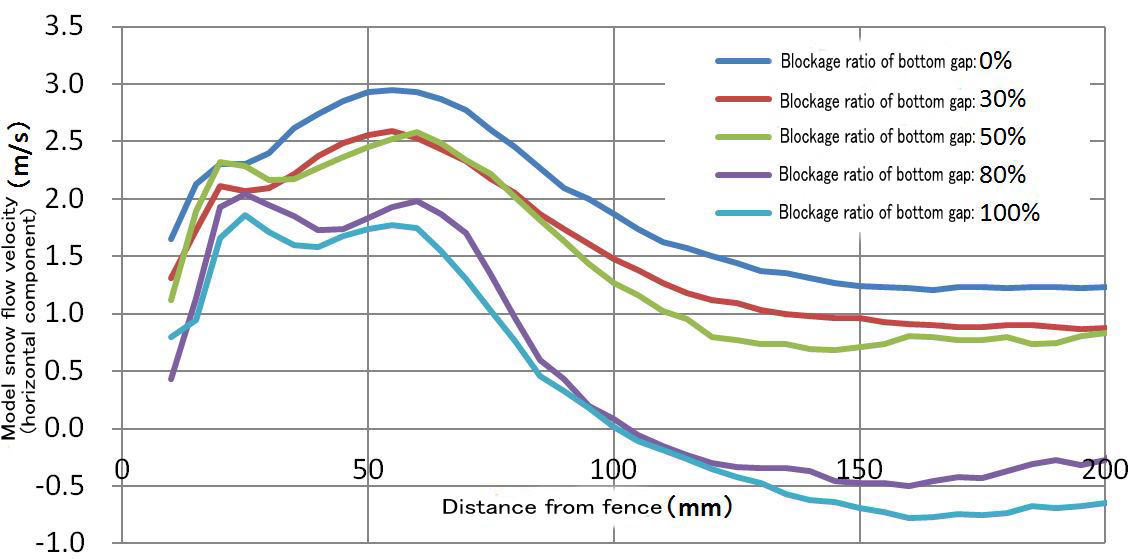
Figure 3 Model snow flow velocity
(horizontal direction component,
H = 5 mm)
(click to enlarge)
1. Purpose of the wind tunnel experiment
Roads in cold, snowy regions like Hokkaido are installed with many snow-control facilities, such as snowbreak woods and snow fences, to mitigate snowdrift formation and poor visibility. At the Civil Engineering Research Institute for Cold Region, the Snow and Ice Research Team has lead research on management methods for enhancing the performance and maintaining the effectiveness of these snow control facilities. For the purpose of preparing basic data for reviewing them, the Machinery Technology Research Team is conducting wind tunnel experiments using a scale model (Figure 1).
2. Study on maintenance of the effectiveness of blower snow fences
An example of a wind tunnel study will be introduced here.
One kind of snow fence is called the blower snow fence. The purpose of this facility is to mitigate visibility hindrances and snowdrifts on roads by diverting lateral winds downward to road surface below the driver's field of vision. Blower snow fences are widely used because they can be installed at the immediate roadside.
It has been pointed out that when the gap at the base of the fence (hereinafter: the bottom gap) becomes obstructed by accumulation or drift of snow, the snow control performance greatly decreases. The deceases in snow control performance have not been quantitatively understood, so the timing and methods of snow removal to maintain the bottom gap have not been clarified.
Therefore, the influence of blocked bottom gap on snow control performance was investigated by wind tunnel experiments.
A 1:100 model was used. Activated bleaching earth was supplied inside the tunnel at 230g/min as the model snow. The wind velocity was set at 7m/s at 400mm above ground. The height of snowdrifts formed and the flow velocity of model snow particles were measured for fiveblockage ratios: 0%, 30%, 50%, 80% and 100%. The results revealed the following. No significant changes were observed up to the blockage ratio of 50%; however, when the blockage ratio was 80% or over, the formation of snowdrifts and decreases in wind velocity were noticeable, leading to great decease in snow control performance (Figures 2 and 3).
3. Conclusion
As shown above, wind tunnel experiments are effective for the basic review of snow-control facilities. For the purpose of preventing disasters caused by snowstorm, we are continuing our research with the Snow and Ice Research Team.
(Contact: Machinery Technology Research Team, Civil Engineering Research Institute for Cold Region (CERI))
