
River environment information website comes online
-Making river environment information more accessible-
In light of survey feedback from citizens' groups engaged in river-related activities, PWRI has developed a one-stop website to provide a variety of information related to river environments, in cooperation with the National Institute for Land and Infrastructure Management (NILIM), and this River Environment Information Website is now online.
The map-based "Web GIS" and other user-friendly interfaces of the website facilitate searches for information such as the results of MLIT environmental surveys of 109 river systems in Japan. Non-expert users can easily obtain river environment information regarding, for example, organisms inhabiting particular rivers, flow rates, water quality, learning opportunities, and river management efforts. The site can also be expected to prove useful in promoting cooperation between citizens and river environment management agencies.
1. Background
The cooperation between river administrators and citizens is important in river-related efforts such as environmental conservation projects and fact-finding surveys. As has often been pointed out, however, insufficient sharing of information with the public is one of the challenges hampering such cooperation. To address this problem, PWRI and NILIM have jointly developed and are operating the River Environment Information Website (http://kasenseitai.nilim.go.jp/riverenvinfo/), to facilitate cooperation between river administrators and citizens.
2. Development of the River Environment Information Website
The system is designed to disseminate river environment information possessed by the government, in an objective, organized, and easy-to-understand manner, so that those interested in river environments have easy access to the information they need. In designing the website, we listened to the needs and opinions of various citizens' groups, which we assumed to be primary users of the website, regarding system features.
3. Features of the Website
(1) Easy access to informationThere are four search methods, by map, area, category, and keyword; and five information categories: biological, water quality/flow rate, river administrator, river learning, and citizen cooperation. The website also introduces information-disseminating websites of the MLIT, prefectural river authorities, research institutes, and citizens' groups.
(2) Easy-to-understand dataInstead of merely presenting numerical details, the website displays water quality and flow rate data graphically, to enable visual understanding of the data.
(3) Information assembled river by riverThere is a dedicated website page for each of the 109 river systems in Japan, showing basic information about each river.
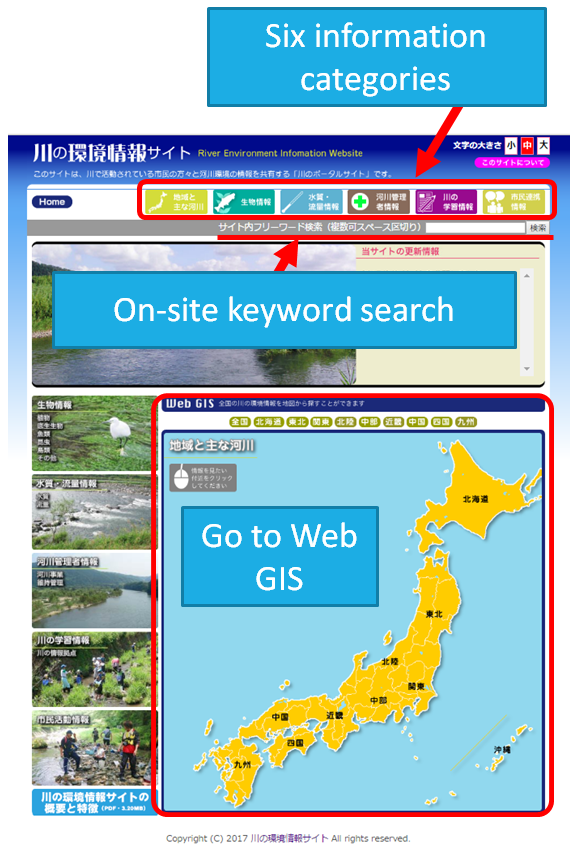
Figure 1 Home page

Fighre 2 How to use the site (examples)
(Contact: River Restoration Research Team)
Development of Moving Wheel Deflectometer (MWD)


As pavement ages and deteriorates over time, its deflection increases, causing damage such as cracks. As a measuring device for evaluating the structural soundness of pavement, Falling Weight Deflectometer (FWD), capable of measuring such deflection, is already used in the selection of repair methods suitable for specific damage sites. However, as pavement deflections are measured by FWD at discrete points and FWD must be kept stationary to measure pavement deflection, it is not able to measure road deflection continuously, and thus requires that roads around the measuring point must be closed or restricted to traffic.
Efforts to develop a vehicle-mounted device for continuous measurement of deflection began at the beginning of the 1990s in some countries, and some devices, such as Rolling Wheel Deflectometer (RWD) developed in the United States (Photo 2), has been put to practice use. However, these devices are not suitable for use as measuring devices for road maintenance in Japan because the measuring system is mounted on a huge semi-trailer that would violate Japan's Vehicle Regulations Order. This is why PWRI has been working on the development of Moving Wheel Deflectometer (MWD), which is mounted on a regular-size vehicle (as in Photo 3), as a device for continuous evaluation of the structural soundness of pavement while moving.
The development of MWD is in progress under a collaborative research of PWRI, research institutes including universities, road surface condition measurement contractors, and measuring device development and manufacturing companies. Figure 1 compares deflection measurements obtained with MWD and FWD on a private road in PWRI. As shown, these measurements are in good agreement.
The development effort is still in progress, with the aim of improving the MWD components and enhancing measuring accuracy through field-testing, in order to develop a practical measurement system.
(Contact: Pavement Research Team)
More Precise Water Resource Management in the Snowmelt Season Enabled by Remote Sensing Technology

in mountains

overground openness at high elevations
In cold, snowy regions, multi-purpose dams cover water use in summer by storing springtime influent snowmelt water. Snow cover is an important water resource. However, snowmelt runoff can also cause flooding and landslide disasters. Therefore, it is critical to precisely estimate the snow cover distributions in mountains as accurately as possible for the purposes of ensuring proper water resource management and disaster prevention. However, knowledge about snow cover distributions at elevations higher than the forest limit is not abundant due to the difficulty of onsite investigation in winter.
Airborne laser scanning is a remote sensing technique that is used for precisely measuring ground surface elevations from an airplane or helicopter. With the aim of clarifying the characteristics of snow cover distributions at high elevations, the Watershed Environmental Engineering Research Team of the Civil Engineering Research Institute for Cold Region has been using this technique to determine snow cover distributions in mountains that are inaccessible in winter (Photo 1). To date, the research team has found that snow depths at elevations higher than the forest limit bear a linear relationship with overground openness, a parameter of ground surface unevenness, and that snow cover is thick in gorge areas and thin in ridge areas (Figure 1). Additionally, unlike forest zones where woods serve as windbreak, there are no woods shielding snow cover from wind in areas higher than the forest limit; thus, snow is driven by strong winds during stormy weather. Consequently, snow cover is relatively thin on windward slopes and is relatively thick on leeward slopes (Figure 2).
In summary, snow cover distributions at high elevations in mountains are affected by landforms and winds. The research team is continuing its current study for the purpose of elucidating the process whereby the primary snow cover that forms immediately after snowfall becomes secondary snow cover as a result of the action of strong winds. By incorporating the elucidated process in a snowmelt and runoff model, the prediction accuracy of inflow volume at dams in the snowmelt season will be increased, and more precise water resource management in the snowmelt season will become possible.
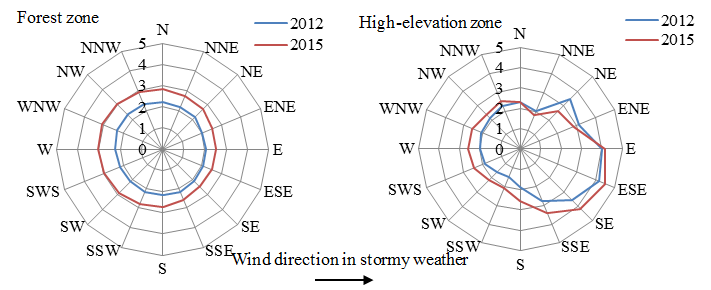
Figure 2 Snow depths for slopes facing various directions
(Contact: Watershed Environmental Engineering Research Team, Civil Engineering Research Institute for Cold Region)