
Toward development of a debris flow-detection method using monitor-camera images

a debris flow

and RGB
1.Introduction
As seen in the case of the Hiroshima disaster of Aug. 2014 and the Northern Kyushu torrential rainfall disaster of Jul. 2017, disastrous debris flows have occurred at short intervals in recent years, endangering the lives and property of people living in these regions. In order to issue timely warnings of such disasters for speedier evacuations, technology that monitors debris flows must be developed. Throughout Japan, cameras have been installed on sediment check dams to monitor mountain rivers; so the ability to automatically detect debris flows by monitoring camera images is counted on to support disaster warnings and early evacuations.
However, there have been few instances of a monitor camera clearly spotting occurrences of a debris flow, and there has been almost no research representing images of an abrupt change of turbidity or water-level fluctuation of a debris flow based on image analysis. Since 2015, the Volcano and Debris Flow Research Team has focused its investigations on the changes in the turbidity and water level of debris flows, aiming to develop a method of using monitor-camera images to detect debris flows.
2.Contents of the research
The heavy rainfall brought by Typhoon No. 9 on Aug. 23, 2016 triggered a debris flow on the Kurodakezawa River, part of the Hokkaido Ishikarigawa River System. Monitor cameras in the area recorded images of the debris flow. Figure 1 is a monitor camera image of a debris flow.
In order to detect a debris flow using camera imagery, it is necessary to spot the changes of phenomena caused by the debris flow, changes never observed during normal flow of the water. Thus, the research began by focusing on changes in turbidity resulting from the addition of sediments to the water. This report presents the results of the study.
The study started with the hypothesis that a change of turbidity is expressed by a change of the luminance value in the image. The luminance value is an index obtained by digitalizing the colors in the image which consists of the three primary colors, red (R), green (G), and blue (B). The colors on the monitor of an ordinary television set, for example, are an aggregation of small points called "pixels", each of which is a mixture of the three colors, R, G, and B, and each has a different brightness, permitting display of an extremely large number of colors. Colors in the images are determined by a balance of hues (gradations of color), luminosity (brightness), and chroma (brilliance).
It is believed that when a debris flow has occurred, the addition of large quantities of sediment to the water increases turbidity, resulting in a change in the hue of the water of a mountainous river. Therefore, the luminance value from before the arrival to the arrival of the debris flow was analyzed to examine changes in the hues of the water caused by the debris flow.
Figure 2 shows the change over time of the luminance value and RGB. The figure shows that in the range of analysis within the white box in Figure 1, before the arrival of the debris flow, the values of G (green) and B (blue) were relatively high. Next, the figure shows that after arrival of the debris flow, the value of R (red) increased relatively. The increased value of R suggests that the hue of the water of a mountain river changes towards a red flow when a debris flow arrives. As shown above, the change of turbidity of a debris flow is presumed to be linked to hue based on luminance value, so occurrence of a debris flow can be detected by a change of the luminance value and the RGB components of a monitor-camera image.
3.Conclusions
This year, we are studying a method of grasping abrupt changes in the water-level phenomenon of a debris flow. The Volcano and Debris Flow Research Team plans to undertake a wide range of research to develop technology to monitor debris flows while conducting joint research with the private sector, including research on image analysis as described in this report.
(Contact: Volcano and Debris Flow Research Team, Erosion and Sediment Control Research Group)
A Study on Sampling the Ground Surface Deformation in the Snowmelt Period by Satellite

the snowmelt period
(Tomamae, Hokkaido)

(diagram)

before and after
the ground surface deformation

(The blue indicates that the distance
between the satellite and
the ground surface has increased.
The red indicates that that
distance has decreased.
Solid lines indicate the range of landslide
interpreted by air-photographic survey.)
In the snowmelt period, snowy regions often experience landslides when temperatures rise and rain fall makesnowmelt water infiltrate into the ground. Large-scale landslides may even close roads and block river channels (Photo 1). It is difficult to visually investigate the deformation of the ground surface due to snow cover. It is also difficult to walk close to the site because of the steep terrain. Therefore, we need a method for accurately and extensively understanding the deformation of the snow-covered ground surface. Our CERI team has been analyzing radar data gathered by the currently operating Advanced Land Observing Satellite 2 (ALOS-2, also called the Daichi 2-go), in order to sample the range and amount of ground surface deformation when landslides occur during the snowmelt period.
ALOS-2 has the highest performance of any L-band microwave-emitting radar satellite in the world. It orbits the earth 14 times a day, returning over the same spot every 14 days. L-band microwaves are about 24 cm in wavelength, allowing them to penetrate clouds, tree branches and leaves. The microwaves are radiated at the ground surface, and their waveforms are observed when the signal is reflected by the ground surface (Figure 1 & 2). To find out the amount of ground surface deformation, measurements are made twice at the same spot by using the same trajectory at different times, and the phase difference is analyzed between the two measured data. One may be able to use microwaves, which can pass through snow cover, to detect the phases reflected at the ground surface with high resolution even in the snowmelt period. However, the velocity of microwave penetration may differ between snow cover and air, as the relative dielectric constant differs between these. This causes a phase delay.
Bearing this in mind, this study corrects the phase delay in order to enable the deformation of the snow-covered ground surface to be analyzed after a landslide (Figure 3). These studies will allow us to sample the range and amount of land deformation caused by a landslide and to use the data for appropriate road management, such as for inspections and traffic restrictions, during the snowmelt period.
(Contact:Geological Hazards Research Team, Civil Engineering Research Institute for Cold Region)
Correspond to Problems at Water Channels and Water Intakes Caused by Ice Jams at Rivers in Cold Regions
In cold regions with severe winter conditions, ice blocks form in rivers when the temperature declines. River ice is classified in two types: ice plates, and ice in slushy frazil particles. The ice flows downstream as the temperature rises, and sometimes blocks the water flow in the channel. This is called the "ice jam" phenomenon.
 (Shokotsu R. in Hokkaido, December 2012) |
 cleared by backhoe. (Nayoro R. in Hokkaido, January 2013) - Courtesy of the City of Nayoro |
 (The ice-covered river looks white.) |
 river ice, and river ice is lifted by the water that flows downstream. |
 (It has cracked and flowed.) |
Problems arising from ice jams are as follows.
(1) The water level of the river may suddenly rise when ice blocks the stream, which may cause flooding.
(2) The ice may flow downstream and collide with river structures such revetments, causing damage to them.
(3) Water intake ports may be blocked by ice, preventing water intake from the river.
(3) is a particularly serious problem in northern and eastern Hokkaido, where the winter temperatures are extremely low. In fact, many municipalities are faced with water intake problems in winter. Workers contribute to water supply maintenance by removing ice from water intake ports, but they face risks from working freezing winter weather. If the times and locations of ice jam formation could be forecast, more efficient, effective responses could be undertaken, such as the prior preparation of staff and other measures.
The Civil Engineering Research Institute for Cold Region (CERI) has studied the mechanisms of ice jam formation and models to reproduce it. Studies have been made at many rivers in Hokkaido, including the Teshio River, one of the large river in Hokkaido. For investigating the countermeasure to water intake and river structure damage, CERI has been conducted field observation and has been developing methods for simply forecasting the times and locations of ice jam formation at many rivers.
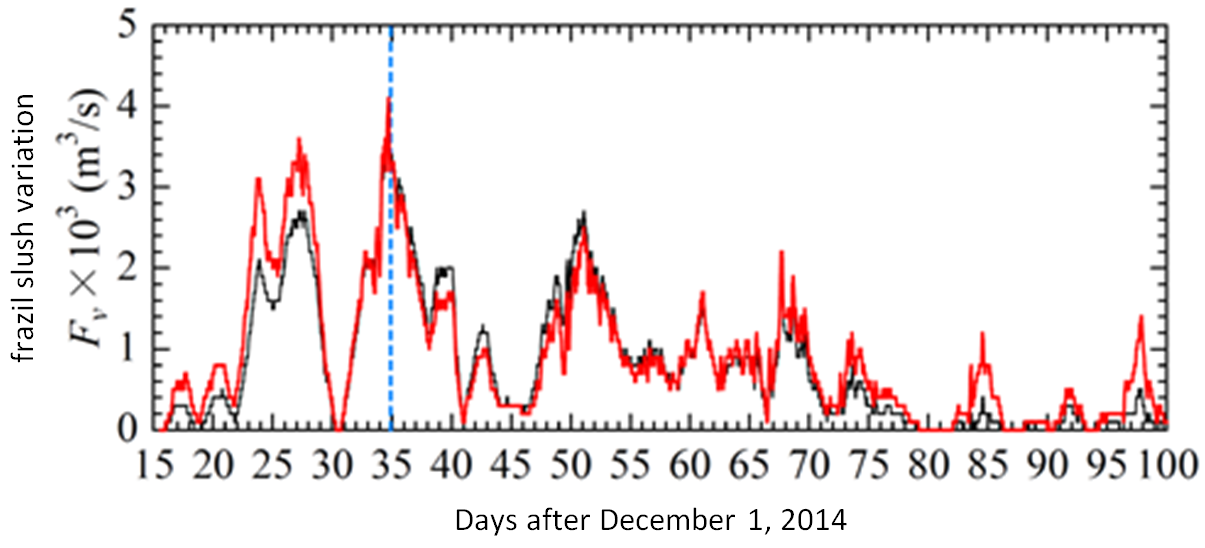
Forecast model for river ice formation that uses frazil slush variation as an index
- Cited from Yoshikawa et al. (2016) "An Estimation Method for Frazil Slush Variation at Intake Facilities on Ice-covered Rivers"
CERI has been working with the Hokkaido Regional Development Bureau and the Kitami Institute of Technology to develop an ice jam forecasting tool that is easy for water supply and river management staff to use. In the forecast model, we suggest frazil slush variation as an index of water intake risk. CERI will continue its studies so that the findings can be applied to stabilizing the water intake at rivers in cold regions and to preventing disasters.
(Contact: River Engineering Research Team, Civil Engineering Research Institute for Cold Region)
Study on the Detection of Snowstorms by X-band MP Radar

Figure 1 X-band MP radar installation location

Figure 2 Differences in performance between
C-band radar and X-band MP radar

Figure 3 Comparison between X-band MP radar
observations and surface observations
(February 20 to 21, 2016)
Introduction
In winter, localized snowstorms occur unexpectedly. To reduce the damage caused by such snowstorms, it is important to understand their occurrences spatially and in real time. This study aims to clarify the possibility of using X-band multiparameter (MP) radar to detect snowstorms. Toward this, radar data and data from surface observations are compared and analyzed.
X-band MP Radar
The Ministry of Land, Infrastructure, Transport and Tourism (MLIT) has been installing X-band MP radar nationwide since 2008. In Hokkaido, the radar was installed in Kitahiroshima in 2013 and in Ishikari in 2014, thereby enabling precipitation to be observed locally in real time in an area within a 60-km radius of Sapporo (Figure 1).
The greatest advantage of X-band MP radar is its high resolution. As Figure 2 shows, the observation time interval of X-band radar is one-fifth that of C-band radar (1 min) and the spatial resolution is one-sixteenth that of C-band radar (250-m mesh).
Example of a Comparison between X-band MP Radar Observations and Surface Observations
Figure 3 compares results of atmosphere observation by X-band MP radar and surface observations at the Ishikari test field. In the figure, the precipitation observed by radar and the snowfall on the ground are both calculated as 10-min precipitation. Wind data are observed as the 10-min average speed for 16 wind directions. The comparison shows that the peak snowfall observed by X-band MP radar and that from surface observations do not always mutually correspond. Not only does a snow particle differ from a rain particle in the time it takes to fall to the ground, but also a snow particle weighs less and falls less rapidly than a rain particle. Thus, a snow particle is more greatly influenced by the wind than a rain particle is. Also, it was verified that the radar observations tend to overestimate the snowfall on the ground.
The Civil Engineering Research Institute for Cold Region (CERI) Snow and Ice Research Team will observe in the surface continuously, verify the relationship between data of atmosphere observation by X-band MP radar and surface observation data, and study the potential for X-band MP radar to detect snowstorms.
(Contact: Snow and Ice Research Team, Civil Engineering Research Institute for Cold Region)