Measurement of Greenhouse Gases Emitted by Behaviors of Construction Machinery

machinery emissions


Exhaust emissions (NOx, HC, CO, and PM) of construction machinery in Japan are regulated by a few laws and regulations, including the Act on Regulation, Etc. of Emissions from Non-road Special Motor Vehicles, in consideration of international harmonization with the European Union, USA, and other countries (Figure 1). In 20-ton class hydraulic excavators and other major machines, marketing started in 2017 for new models compliant with the 2014 regulations.
The emissions situation is currently undergoing drastic changes. In 2017, the EU instituted a mandatory on-road driving test of vehicles manufactured to drive on public roads. It has been determined that the same regulation will be put into action in Japan in 2022. In the EU, measurement of emissions of construction machines during actual operation is also mandatorily regulated. Meanwhile, the US government has established control values for nitrous oxide (N2O) (with a greenhouse effect 298 times that of CO2) and methane (CH4) (25 times), among greenhouse gases (GHG), not regulated in the EU or Japan. It has also been reported that engines designed to reduce emissions of NOx with a urea-selective catalytic reduction system (urea SCR) produce more N2O than those without.
It is possible that measurement evaluation of GHG for construction machines will be picked up as a topic of discussion in the future. In judging the necessity of measurement evaluation, knowledge of measurement methods and measurement values of a variety of construction machines is necessary. While the measurement method for on-road driving tests of vehicles that drive on public roads is established based on the policy of applying conditions close to actual driving, there is great variation in the loading applied to construction machines during actual operation. For example, when soil adheres to the belt or bucket, it will greatly increase the load applied to the machine. Therefore, when measurement is performed under conditions close to actual operation, we understand that it will result in greater deviation and eventually fail to accurately evaluate emissions. The emission characteristics of exhaust gas depend on the type of emission gas, the type of behavior, and measurement conditions.
The Public Works Research Institute (PWRI) measures emissions from construction machines to get a rough grasp of the GHG conditions in Japan. Specifically, a hydraulic excavator is operated to perform various behaviors, including driving and simulated excavation, N2O, CH4, and already regulated gases that are emitted by the excavator are measured with Fourier transform infrared spectroscopy (FTIR). Based on this measurement, PWRI analyzes the differences in emission characteristics depending on the type of gas, factors that cause the measurement values to increase or decrease, and conditions that stabilize the measurement, thereby studying methods that enable a simple and accurate understanding of the general condition of GHG in Japan (Fig. 2 and 3). According to our measurement of emissions from the machines compliant with the 2014 regulations (or 20-ton and 13-ton class hydraulic excavators), the emissions of the regulated gases were suppressed incomparably, as shown in the example in Fig. 4. We plan to announce the measurements of the GHGs of N2O and CH4 in the near future.
(Contact: Advanced Technology Research Team)
Development of a Camera for Observation in Collector Wells


observation camera
Introduction
Landslides mainly occur when groundwater increases due to heavy rainfall or snowmelt. Facilities to discharge the groundwater out of the slide area are installed to prevent the occurrence of landslides. One such facility, the collector well (Photo 1), serves to discharge groundwater out of the slide area by collecting it from the slide area into a well and discharging it outside the slide area. But it has been 60 years since the Landslide Prevention Act was enacted (on March 31, 1958), and collector wells are deteriorating. To assess the condition of the wells, inspections are conducted to check the wells for the condition of the groundwater collecting function or for damage. However, if someone goes down into the well for inspection, it is likely they will be exposed to various dangers, such as intake of toxic gas, oxygen deficiency, or falling from corroded or deteriorated steps.
For that reason, we developed a system to monitor the inside of collector wells using an omnidirectional camera so that we can inspect the well interior by remote control from aboveground without anyone entering the well.
Camera for Observation Inside Collector Wells
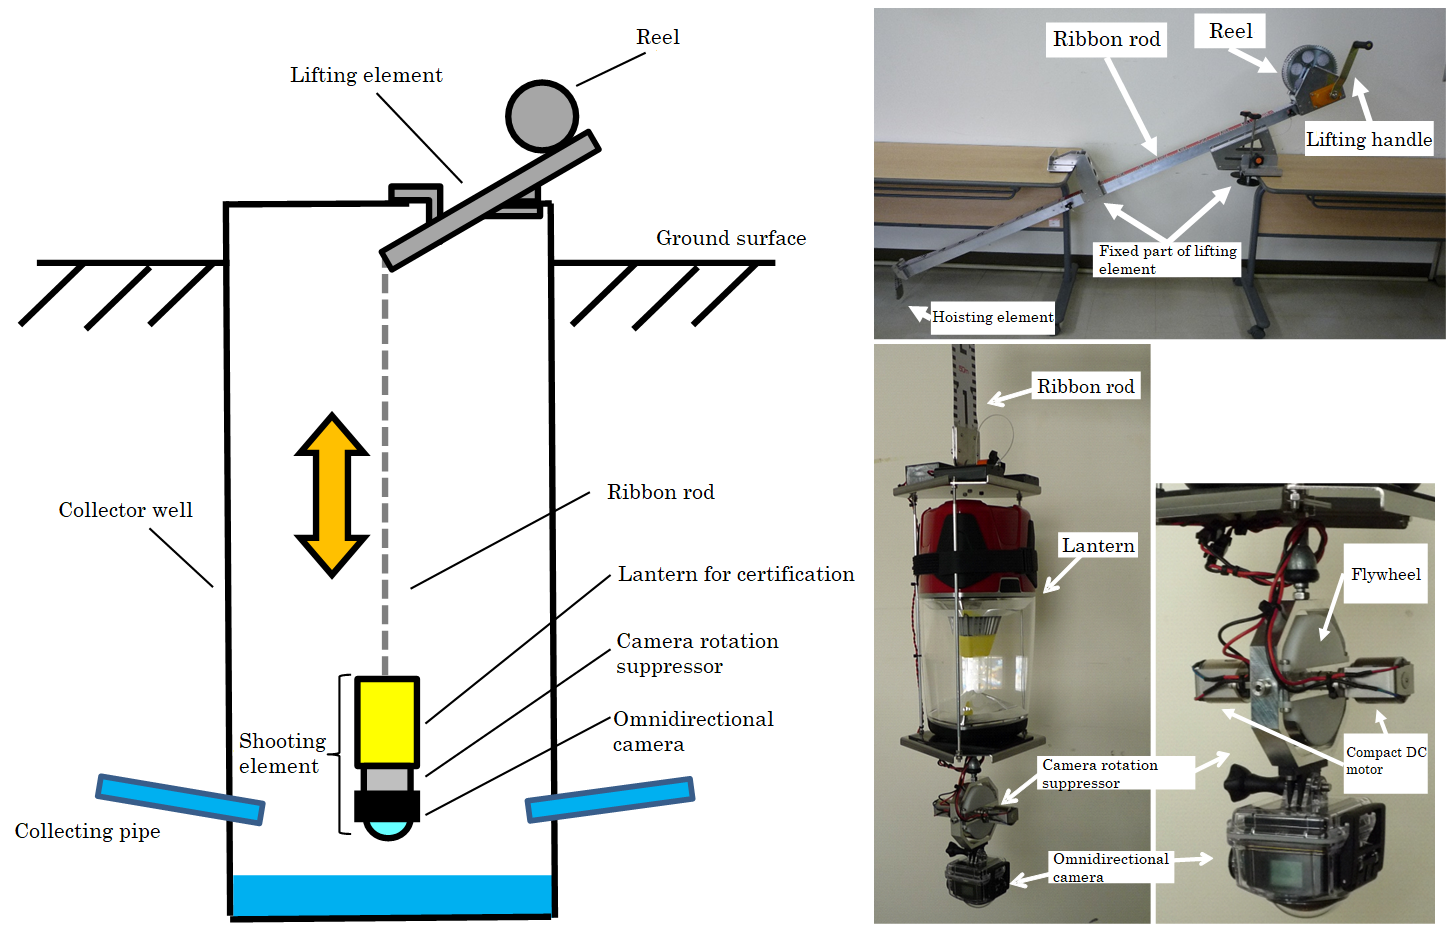
The camera for observation inside the collector well can be roughly divided into the shooting element and the lifting element. The shooting element is fitted with an omnidirectional camera that can monitor the entire 360-degree view at once. This shooting element is hoisted from the lifting element, and it moves up and down to shoot the entire inside of the well at once (Fig. 1).
It is composed of an omnidirectional camera housed in a waterproof case, a lantern for lighting, and a rotation suppressor that stops unnecessary rotation of the hoisted camera. A 4K image, 360-degree-action camera is used as an omnidirectional camera. Since the inside of the well is mostly beyond the reach of sunlight, making it hard to shoot a clear image, the shooting element is outfitted with an LED camping lantern with a light intensity of 1000 lumen. The system can check the shot image from on the ground in real time by connecting the omnidirectional camera to a tablet terminal via WiFi. The rotation suppressor is composed of a flywheel and gimbal shaft (rotating table) and is designed to rotate the flywheel at a high speed with two compact DC motors to generate a gyro effect, thereby suppressing the lateral rotation of the camera.
The lifting element is composed of an aluminum platform and a reel, and is fixed at two points, front and rear, on the frame of the entrance provided in the lid of the well. A ribbon rod (50 m long and 60 mm wide) is wound around the reel, and the shooting element is attached to the tip of the extended ribbon rod. During inspection, the lifting element is inserted toward the center of the well through the well entrance, and the lifting handlebar attached to the reel is manually rotated to adjust the length of the ribbon rod to move the shooting element up and down.
Photo 2 is a 360-degree panoramic photograph taken on site by the observation camera. This system allowed us to safely and efficiently monitor the rough condition of the inside of the collector well from the ground. We intend to promote more R&D of this system, particularly on how to obtain a more detailed image or sort out the shot images.

Photo 2: 360-degree panoramic photo taken by the camera
(Contact: Snow Avalanche and Landslide Research Center)
A Study on a Design Method for Rockfall Protection Structures for Roads


Japan has a steep geography and vulnerable geology over a wide area. The average annual number of sediment-related disasters due to heavy rains, earthquakes, etc. in the past ten years (2007-2016) was as many as 1,000. These disasters caused enormous damage. In order to prevent and mitigate damage from sediment-related disasters, Japan is promoting comprehensive sediment-related disaster preparedness measures, including the development of sediment-related disaster protection structures (White Paper on Land, Infrastructure, Transport and Tourism in Japan 2017).
Rockfall disasters are a type of sediment-related disasters (slope failures). Structures to prevent rockfall disasters include rockfall protection structures like those shown in Figure 1 (rock-sheds, rockfall protection walls/fences, etc.). Rockfall protection walls and fences are structures that are installed in the middle or lower part of a slope (foot of the slope) to prevent rocks that fall down the slope from interrupting road traffic or causing trouble to road users, etc. Conventional rockfall protection walls are typically made of unreinforced concrete. Typical rockfall protection fences have relatively simple structures, which consist of H-shaped steel posts, wire ropes and wire nets. Rockfall protection walls and fences are widely used for areas where the scale of the rockfall phenomenon is relatively small. These structures can also be used in combination, as is the case in Figure 1
Through past inspections, it was discovered that some structures were subject to disaster risks that exceeded the rockfall loads estimated at the time of design of the structures, due to geographical changes to the slopes over time. This highlighted the need for determining the margin of safety. Moreover, in past rockfall events, existing structures incurred damage that was not predicted at the time of design.
With a focus on rockfall protection walls/fences, the Structures Research Team has made a large model in CERI's test field and carried out weight impact tests using a steel weight simulating a rockfall (see Figures 2 and 3). The aim is to find out the structure's behaviors and the extent of damage caused by rockfall impact based on the test results and to establish an analysis method that allows rockfall impacts to be accurately reproduced. We are looking to propose a new design method for conventional rockfall protection walls/fences based on the test results.
(Contact: Structures Research Team, CERI)
A Study on Interactions between Sea Ice and Coastal Structures
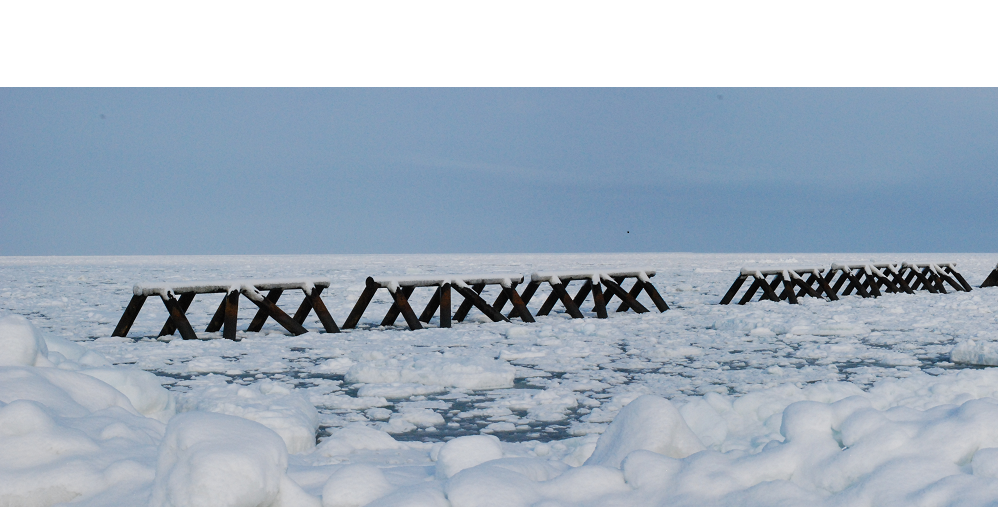
The Okhotsk Sea is covered with sea ice (ice sheets, drift ice, etc.) during winter. Sea ice has a serious impact on the fishery industry and marine traffic in Japan, causing such problems as decreased fishing opportunities, damage to ships and cultivation facilities, and marine accidents. To address these issues, Japan has established some sea ice control facilities in the area. Among them, ice booms (Figure 1(a)) were installed at the entrances of Lake Saroma and Lake Notoro, which are connected to the Okhotsk Sea, in order to prevent sea ice that drifts into the lakes from damaging the cultivation facilities. An ice boom consists of several floating bodies to trap sea ice, wires to connect the floating bodies, and pile structures to transfer the load of trapped sea ice. In addition, ice control facilities made of steel tubes were installed parallel to the coastline of the Okhotsk Sea in order to protect fishery resources (kelp, sea urchin, etc.) from drifting sea ice (Figure 1(b)). We have studied a method to accurately estimate interactions between these structures and sea ice, especially mechanisms of ice fracture load on the structures, etc. Specifically, we have developed a method to estimate load on ice booms and the ice's behaviors with external forces of currents (ocean currents and tides), using a multifaceted approach, which involves hydraulic model experiments (Figure 2), theoretical analysis, and numerical simulations using a distinct element method (Figure 3). This method was used for calculating external forces in the basic design of the ice booms in Lake Notoro (Figure 1(a)).
In addition to the quasi-static loads, the collision forces by active sea ice need to be also considered. Sea ice with high drift speed can cause local deformation of or damage to structures (Figure 4). Collisions with pillars or legs of a structure in particular may result in destruction of the entire structure. We are working on the development of a tool to estimate ice collision load, fracture mechanisms, etc. based on medium-scale experiments, theoretical analysis, and numerical simulations (Figures 5 and 6).
Moreover, contact and friction between sea ice and coastal steel/concrete structures have resulted in wear of and damage to the surfaces of the structures. These structures are expected to deteriorate quickly. We have also been working on developing countermeasures against sea ice actions and establishing a maintenance method using our numerical and theoretical tools for static and dynamic ice behavior and ice load (Figure 7).

Figure 7 Wear of concrete structure caused by sea ice (left) and simulation
of the wear and abrasion process (right)
(Contact: Port and Coast Research Team, CERI)


