
Research on a Natural Treatment Method for Acidic Water Using Iron-Oxidizing Bacteria

Water in Construction Waste Soil
In road tunnel construction sites, excavated soil containing a large amount of rocks and stones is sometimes temporarily kept on the surface of the ground as waste soil. Easily oxidizable minerals contained in the waste soil react chemically with atmospheric oxygen and rainwater and generate acidic water (Figure 1). Constructors usually neutralize such acidic water with alkaline chemicals at temporary construction facilities to comply with the national effluent standards. The detoxified water is then discharged into rivers etc. However, acidic water often contains a large amount of dissolved iron, which has the effect of inhibiting the neutralizing effect of the chemicals. In order to achieve effective neutralization, it is necessary to remove the iron contained in the water. However, chemical precipitation/removal of iron is quite costly.
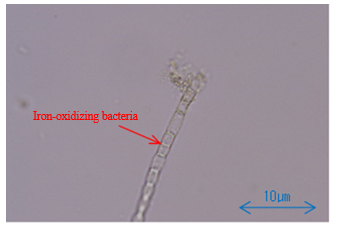
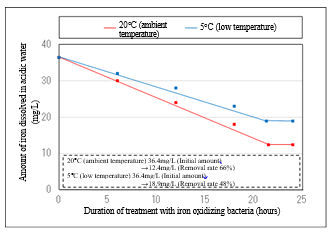
To address this environmental issue, Geological Hazards Research Team focused on iron-oxidizing bacteria as a solution that taps into natural purification mechanisms and minimizes resources and energy consumption. Iron-oxidizing bacteria are filamentous bacteria with a diameter of 0.5 to 2.0 µm and a length of 200 to 400 µm (Figure 2). They oxidize iron dissolved in water, and store and precipitate insoluble iron compounds in their bodies. We collected iron-oxidizing bacteria in the field, cultured them in the laboratory, and analyzed their metal reduction effect in acidic water under different reaction conditions (temperature, water quality, etc.). The analysis results show that 66% of iron was removed after 21 hours at ambient temperature (Figure 3). In the future, we hope to clarify the optimum culture conditions for these bacteria and develop a natural treatment method that can efficiently remove metal components.
 |  | reduction effect of iron-oxidizing bacteria |
(Contact: Geological Hazards Research Team, CERI)
Research on a Stability Evaluation Method for Snow Eaves Formed on Snow bridges

Introduction
In winter, snow bridges are put into place on side slopes to protect roads from the risk of avalanche. When snow depth is high, the mass of snow developed on these bridges sometimes partially sticks out from the top edge of the bridges (Figure 1). If these "snow eaves" continue to grow larger and eventually collapse, it may not only trigger an avalanche, but it may also put passing vehicles in danger of being hit by falling snow blocks.
In order to establish a method to evaluate the stability of snow eaves on snow bridges and determine what size of snow eaves entails the risk of collapse, we conducted observations of the shape and physical properties of snow eaves and worked to develop a stability evaluation model.
Observation of Snow Eaves
We conducted observations of the shape, snow quality, and density of snow eaves formed on snow bridges on the side slopes of the roads on National Highway Route No. 275 in Shumarinai, Horokanai-town. In an observation conducted in the snowiest period (February 21, 2018) (Figure 2), an enormous snow eave projecting 1.4 m forward and 2.0 m upward beyond the snow bridges was observed. The density profile had a layered structure and the average snow density was 181 kg/m3
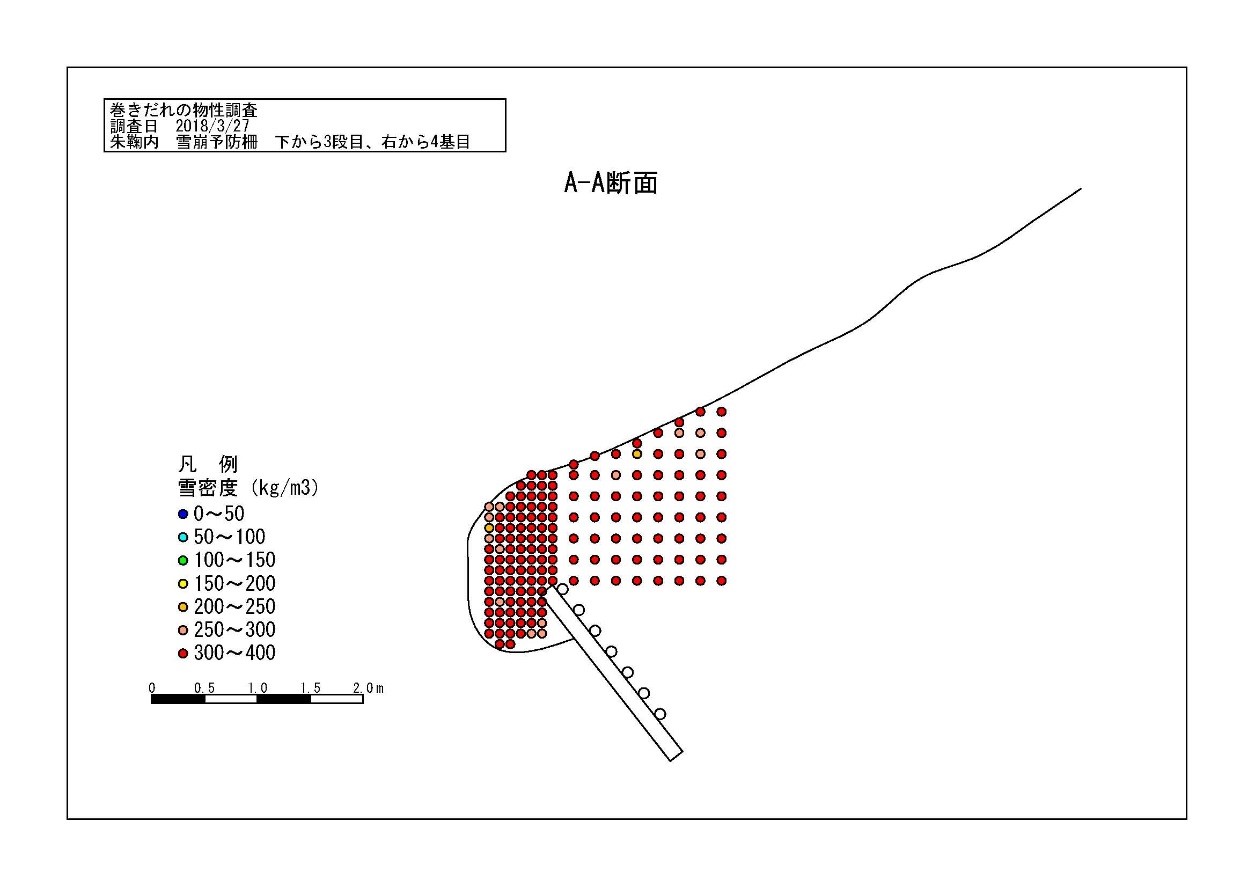
In an observation conducted in the snow melting period (March 27, 2018) (Figure 3), the snow eave had become smaller, projecting 1.1 m forward and 0.7 m upward beyond the snow bridges. The snow density was homogenous across the eave, with an average of 348 kg/m3
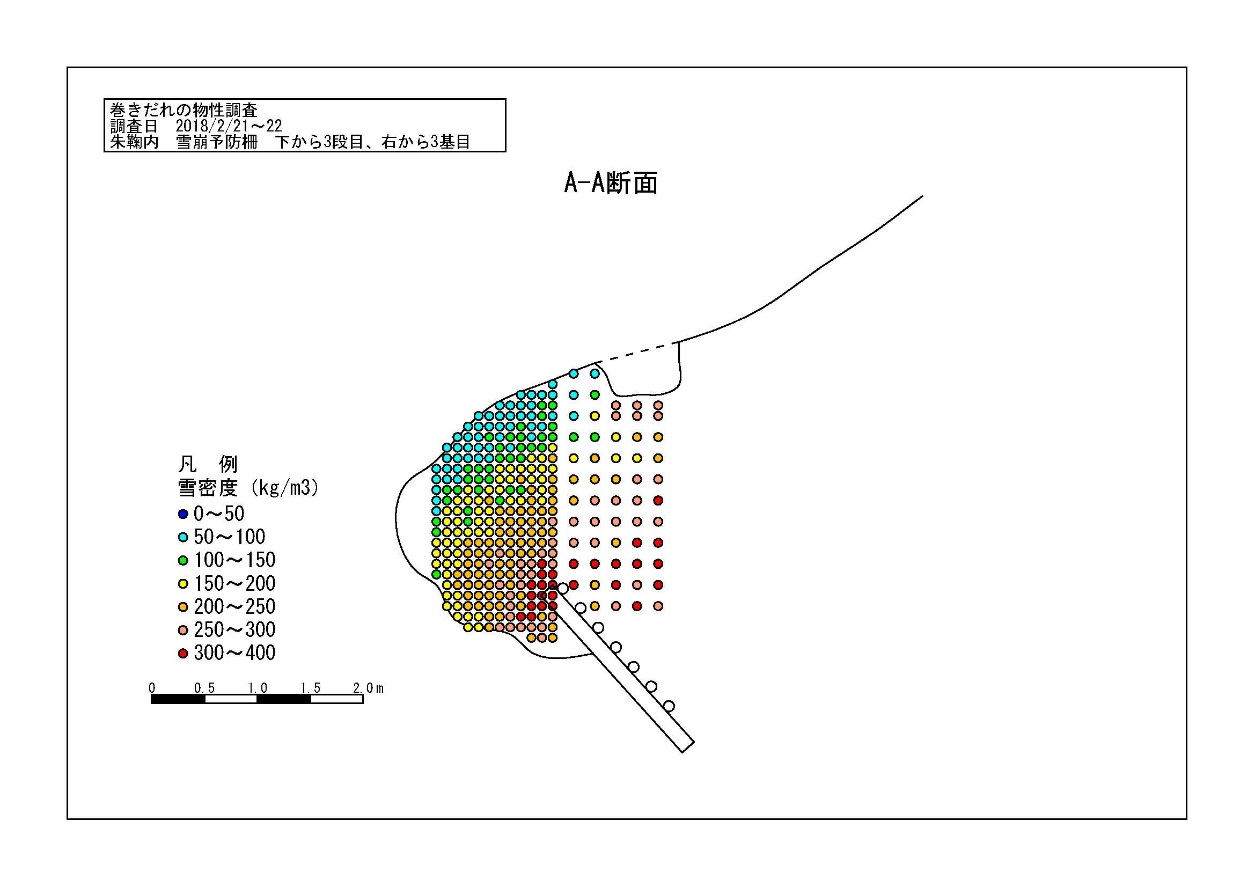 |  | of the snow eave observed in the snowiest period (February 21, 2018) |
density of the snow eave observed in the snow melting period (March 27, 2018) |
Evaluation of the Stability of Snow Eaves
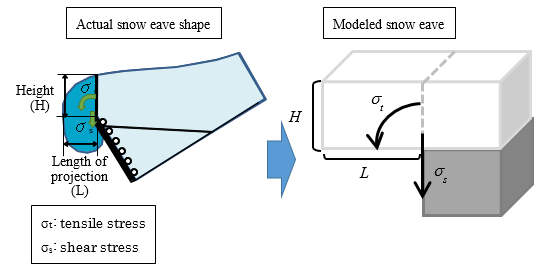
We developed a simplified model based on the observed snow eave shape (Figure 4) and determined the strength of snow based on the observed snow density data. The strength of snow was calculated based on the snow density and snow wetness. Also, the stress acting on the fracture surface of the snow eave (σt and σs in Figure 4) was determined based on the density and shape of the snow eave. We calculated the ratio of the strength of the snow eave to the stress acting on the fracture surface as an index of stability. As a result, the stability was calculated to be 2.1 for the snow eave observed on February 21, 2018 (Figure 2), while that of the snow eave observed on March 27 of the same year decreased to 1.3 (Figure 3). In fact, it was found that the snow eave observed on March 27 collapsed the following day, indicating that the calculated stability was generally consistent with the actual stability.
We plan to continue our observations to clarify the conditions under which snow eaves tend to form.
 |
(Contact: Snow and Ice Research Team, CERI)