
How is the Water Level of a River Measured?

Example of installed staff gauges

Float-type water level gauge
(Suiken Model 62)

Example of an installed float-type
water level gauge

Example of an installed bubble-type
water level gauge
The water level is defined as the height of the water surface measured in relation to a reference point (the reference point is separately set for each water level observation station). River administrators measure water levels in centimeters at either 1-hour or 10-minute intervals, for the purpose of river management. During floods, water level observations provide crucial information for flood forecasting and flood control activities. During droughts, water level observations are equally important to manage the intake volume and intake level of water for irrigation.
In addition to continuous maintenance and improvement of equipment to ensure measurement accuracy, observation methods are also developed and improved to ensure that equipment will remain functional during floods and not become inoperable by being buried in sediment. The following observation methods are currently in use.
1.Manual Reading Method: :A graduated staff gauge is installed in the water, and the water level is read visually. In the past, standard observation stations were established across the country, and residents living near the rivers were asked to observe the water level twice a day (or hourly during floods). This is the most reliable method of measuring water level, and even today, staff gauges are always installed at observation stations to verify water levels during routine inspections of water level gauges as well as water flow rate measurement as described from Method 2 on.
2.Float Method: A float is placed on the water surface, and its vertical movement is recorded on a chart using a wire or similar mechanism. To prevent the float from the effects of river currents, a cylindrical observation well?connected to the river via an intake pipe and sharing the same water level?is installed in the river. There is also a reed switch type, which detects the float’s position using magnetism.
3.Water Pressure Measurement Method:A pipe extends from a monitoring hut on the riverbank into the water, where it slowly releases bubbles. The pressure inside the pipe when a bubble is released is measured by a pressure sensor inside the hut. The pressure inside the pipe equals the sum of atmospheric pressure and the water pressure at the pipe’s opening. By subtracting atmospheric pressure, the water pressure at the opening can be determined, which in turn is used to calculate the water level. Nowadays, it is more common to install pressure sensors (such as quartz-type sensors) directly underwater to measure the water pressure directly.
4.Ultrasonic and Radar Method:A transmitter-receiver is installed directly above the water surface, and the time it takes for ultrasonic or radar waves to travel to the water surface and be reflected back is measured. This time is used to calculate the distance between the water surface and the sensor. Since measurement does not involve actual contact with the water, this method is less prone to damage during floods.
5.Image-Based Method:Although not as accurate as the methods mentioned above, this method involves a simpler observation technique using CCTV camera images to identify the position of the water surface. By combining this information with staff gauge readings or pre-surveyed data, the water level is determined. Since this method also allows non-contact measurement, it serves as a backup method in case other water level gauges are damaged and become inoperable during major floods.
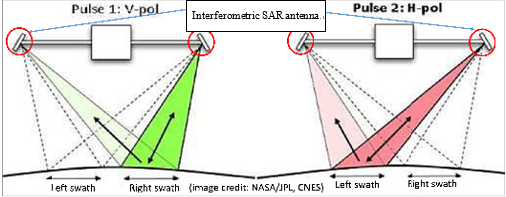
Another advanced method involves the use of satellites. The SWOT (Surface Water and Ocean Topography) satellite, launched by NASA in Dec. 2022, is equipped with two interferometric SAR antennas. By calculating the phase difference between the two antennas, the imaging angle can be determined and the absolute elevation of the water surface can be calculated. This method is primarily used to observe rivers with a width of at least 100 m, as well as lakes and oceans. Water levels are measured along the center of rivers at approximately 200 m intervals, with an accuracy of approximately ±0.1 m. Observations of Japan and its surroundings are made roughly once every 10 days, and although the current imaging frequency and accuracy of these satellite images are not sufficient for official water level monitoring, the ability to capture wide-area, high-density river water levels at a given moment provides previously unavailable data, and the future application of this technology is highly anticipated.
Please also see an article on satellite-based water level observation published in the Jan. 2025 issue of Civil Engineering Journal.
 Example of an installed ultrasonic water level gauge |
 SWOT imaging |
 by SWOT satellite compared with water level gauge measurements |
References
1) Hydrological Observations, FY2002 Edition
https://www.pwri.go.jp/team/hydro_eng/suimon_kansoku.htm
2) Technical Guideline for River and Sediment Control (Draft), Survey Edition,Chapter 2, Section 3
https://www.mlit.go.jp/river/shishin_guideline/gijutsu/gijutsukijunn/chousa/pdf/chousa_02_03.pdf
3) Overview of Hydrological and Water Quality Observation-Water Level
Measurement Methods (MLIT Hydrology and Water Quality Database)
http://www1.river.go.jp/hkansoku.html
4) Guideline for Water Level Observation Using CCTV Cameras and Other Devices (Trial Version)
https://www.mlit.go.jp/river/shishin_guideline/kasen/pdf/cctv_tebiki.pdf
5) SWOT Measurement Concept (eoPortal website)
https://www.eoportal.org/satellite-missions/swot#measurement-concept
6) Understanding River Water Levels using SWOT Satellite Information (Civil Engineering Journal, Jan. 2025 Issue)
(Contact : Flood and River Response Monitoring Team)
Low-Carbon Concrete-Durability Evaluation in Real Environments

Figure 1
Durability verification test of
low-carbon concrete

※Under these environmental conditions,the depth of
carbonation is expected to remain shallower than
the depth where the reinforcing steel is located
(typically 30 mm or more) over the long term.
Figure 2
Carbonation progression in low-carbon
vs. conventional concrete

※In these cross-section photos, the upper side represents the
surface of the concrete. The areas not stained by
phenolphthalein solution indicate carbonation.
Figure 3 Results of the shear test
Concrete is an essential construction material for the development of social infrastructure. However, a significant amount of carbon dioxide is emitted during the burning process involved in the production of cement, which is a key ingredient of concrete. In response, there has been growing interest in the use of low-carbon concrete, in which some of the cement is replaced with industrial by-products such as blast furnace slag.
Even before concerns over carbon dioxide emissions and global warming became prominent, concrete that incorporates industrial by-products had been used in certain structures. However, when early strength development or high durability is required, there still is hesitation about the use of such concrete due to limited track records and lingering concerns, preventing its adoption in some cases. In particular, reducing the ratio of cement incorporated in concrete has raised concerns about early onset of carbonation?a deterioration phenomenon in which concrete reacts with carbon dioxide in the atmosphere, resulting in neutralization of its alkalinity and potential corrosion of the reinforcing steel inside. To address this problem, PWRI has been conducting long-term durability tests of low-carbon concrete, which was made with industrial by-products, under harsh environmental conditions. (Figure 1)。
As a result, it was confirmed that carbonation of low-carbon concrete is suppressed when it is exposed to rain outdoors (Figures 2 and 3). This is likely because rainwater keeps the interior of the concrete sufficiently moist under real-world conditions. This moisture fills the pores and pathways inside the concrete, impeding penetration by carbon dioxide. It is also known that the carbonation resistance of concrete incorporating industrial by-products can reasonably be estimated based on the mix ratio. However, when the cement content is significantly reduced?to around 15% of the conventional level?the progression of carbonation tends to differ from that of higher percentages, and careful attention is required. Although the details are not introduced here, testing under real environmental conditions has also shown that low-carbon concrete is more resistant to chloride penetration, which improves durability against salt damage, such as the corrosion of reinforcing steel in concrete structures located along coastlines.
Since civil engineering structures are designed for long-term use-often over a span of 100 years-high reliability is required of the materials used. While laboratory-based accelerated deterioration tests are sometimes necessary to evaluate new materials, it is equally important to assess their durability under actual environmental conditions to validate those test results. PWRI will continue these steady, long-term efforts to ensure material reliability.
(Contact : Materials and Resources Research Group)
Vehicle Speed Reduction Measures for Community Roads and School Zones in Snowy Cold Regions
-A Study on Traffic Calming Devices Installed on Roadways-

Figure 1
Three types of traffic calming devices

Photo 1
An asphalt hump (test product) in a school zone
Reducing vehicle speeds to below 30 km/h significantly reduces the risk of pedestrian fatalities from vehicle collisions. On community roads and in school zones, traffic calming devices are sometimes installed to achieve such a reduction. The installation of these devices is regulated under Article 31-2 of the Road Structure Ordinance (a Japanese government ordinance on technical standards for road structures based on the Road Act). The types of traffic calming devices include humps (raised sections of the roadway), narrowings (narrowed sections of the roadway), and chicanes (cranks or slaloms), as illustrated.(Figure 1)。
In snowy cold regions such as Hokkaido, there are concerns that humps may be damaged by the blades of snow removal machines and that the effectiveness of narrowings and chicanes may be diminished by snow piled at the road shoulders. The flat section of humps is elevated 10 cm above the road surface(Figure 1). Due to concerns that mechanical snow removal may damage these raised structures, many municipalities are hesitant to install humps during the winter. There has been a lack of empirical data showing how much damage humps incur from mechanical snow removal or how effectively they reduce vehicle speeds in winter. This lack of data has been one of the reasons that municipalities remain cautious about installing humps during the winter months. Additionally, in order for humps to maximize their speed-reduction effectiveness, the inclined sections viewed from the side should ideally form a gentle S-curve(Figure 1). However, few contractors in snowy cold regions have the knowledge or experience necessary to construct S-shaped inclined sections.
Therefore, the Traffic Engineering Research Team at the Civil Engineering Research Institute for Cold Region (CERI) of the Public Works Research Institute (PWRI) has conducted the trial installation of an asphalt hump that is a test product in a school zone in a municipality in Hokkaido(Photo 1). Through this trial, the team has been collecting empirical data on the extent of damage to the test product caused by mechanical snow removal and the effectiveness of the test product in reducing vehicle speeds during the winter. This trial marked the first time for S-shaped formworks to be employed in Hokkaido to shape the inclined sections of the humps(Photo 2). In addition, vehicle speeds were surveyed at three road sections before the test product (0~10 m, 10~20 m, and 20~30 m before), and the proportion of vehicles exceeding 30 km/h in each section was determined(Figure 2) to evaluate the speed-reduction effectiveness of the hump in winter.

Construction of an inclined section of the hump using two S-shaped formworks |

Proportion of vehicles exceeding 30 km/h in each section before the hump |
(Contact : Traffic Engineering Research Team, CERI)
Development of a Subsidence Risk Map for Large-Scale Agricultural Fields in Peatland Areas

Figure 1
Conceptual diagram of uneven subsidence in a paddy field

Photo 1
A paddy field with uneven subsidence
1.Uneven Subsidence in Large-Scale Fields in Peatland Areas
Peat soils, which form over long periods by the accumulation of dead plant material, are commonly distributed near rivers and lakes. Peat is characterized by higher porosity and organic matter content than other soils. Because of these characteristics, peat can shrink in volume due to the collapse of voids or the decomposition of the organic matter, ultimately leading to ground surface subsidence. When this subsidence occurs unevenly, it is referred to as uneven subsidence(Figure 1, Photo 1). At agricultural fields in peatland, uneven subsidence within a single field can cause operational issues. For paddy fields, it becomes difficult to maintain a uniform depth of pounding. For upland fields, it can result in inconsistent soil moisture across the field. In addition, cases have been reported where uneven subsidence affects farm roads and irrigation/drainage channels, necessitating repairs.。
In Hokkaido, efforts are under way to increase agricultural productivity by expanding the scale of agricultural fields. The Ishikari and Sorachi regions, which are among Japan’s major peatland areas, are also undergoing large-scale field consolidation. While consolidation improves the efficiency of farming operations, it is also known to increase the likelihood of uneven subsidence, which poses a constraint on the further enlargement of field plots. Factors associated with uneven subsidence in large-scale fields include soil-cutting and banking construction during consolidation, as well as the cultivation history prior to consolidation. For example, fields with thicker banked layers are more prone to subsidence due to the increased load, and fields previously used for long-term paddy rice cultivation tend to retain more moisture in their peat and to have a higher porosity of peat than those used for upland farming, making them more susceptible to subsidence after consolidation.
2.Development of a Subsidence Risk Map
Until now, the zonation of subsidence-prone areas has typically relied on peat classification and peat thickness distribution maps(Figure 2). However, these maps have scales of hundreds of meters to hundreds of kilometers, making it difficult to accurately predict which individual fields?or which parts of a field-are more susceptible to subsidence. In contrast, data on soil-cutting and banking thickness(Figure 3) and pre-consolidation cultivation history are available at the finer scale of several tens of meters. Therefore, this study aims to establish a method that combines data such as field-specific cultivation history and the thickness of cuts and banks(Figure 4) to visualize subsidence-prone areas in greater detail, while minimizing survey costs and labor. If areas with a high risk of subsidence can be identified in advance, it will become easier to implement countermeasures during the design and construction of consolidation projects, as well as in the planning of farming practices. Accurate subsidence risk maps are expected to facilitate the smoother implementation of large-scale field consolidation.

Map of soil types and peat classification |

Map of cut and embankment thicknesses in a consolidation project |

(Contact : Rural Resources Conservation Research Team, CERI)