Initiatives for advanced observation of the amount of water flow
Plans involving predictions of how much water will be discharged in the event of a flood or drought are essentially based on the amount of water flow. To design such plans, then, it is essential to monitor the flow of rivers on a daily basis. The amount of flow is calculated based on current velocity and sectional area; thus, we must regularly measure the current velocity and water level of such rivers.
Until now, the current velocity in the event of a flood has been calculated by dropping a floating bar called a "fushi" into the river and manually measuring its time of passage. However, approaching a river in the event of a flood is dangerous, and such manual measurement has become difficult in recent years due to a lack of workers, etc. Thus, PWRI has developed a non-contact current meter to measure current velocity without requiring human labor.
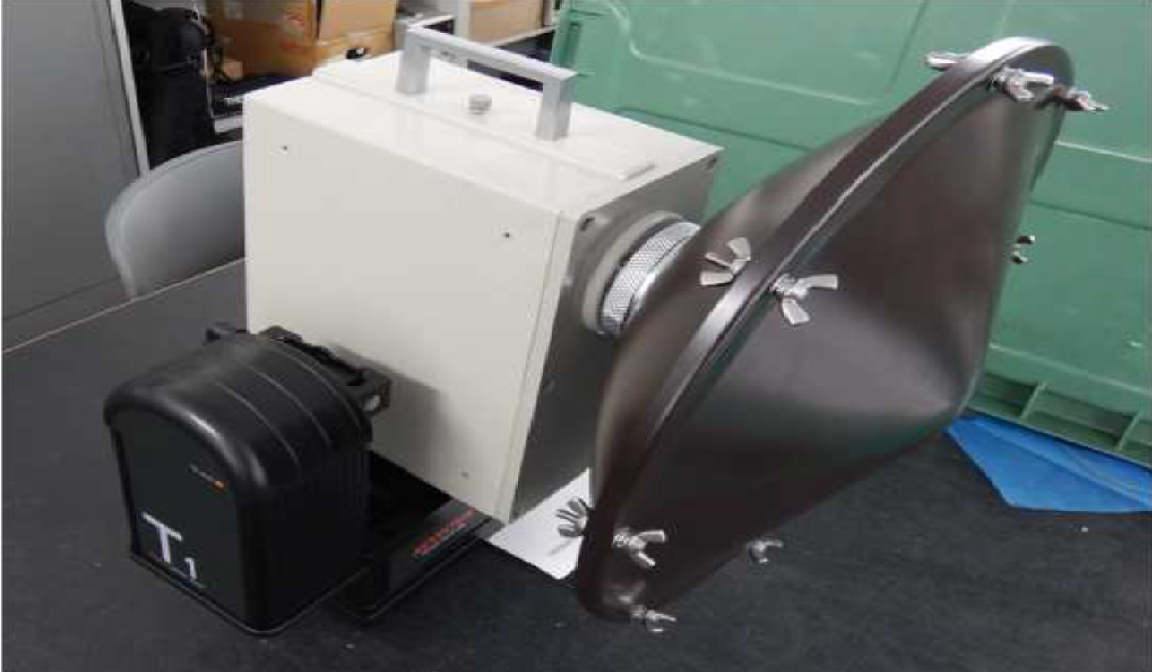
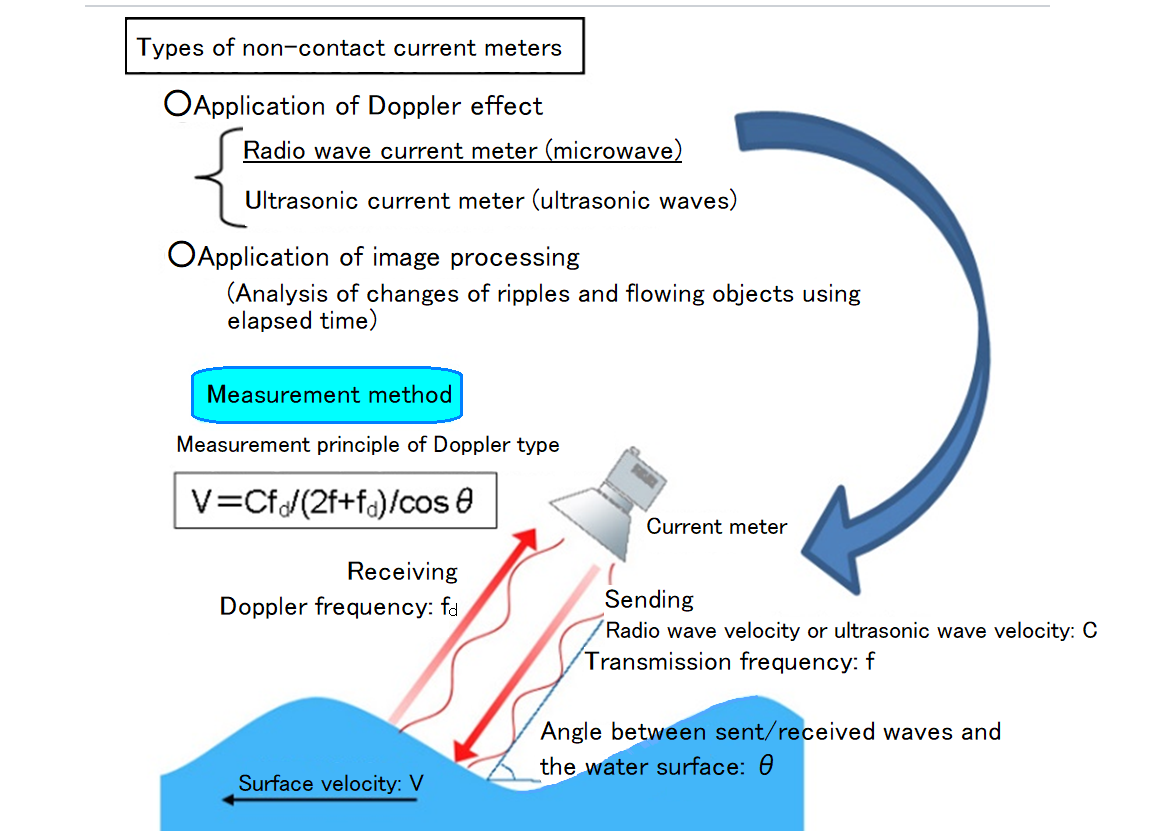
Photo 1 shows the developed radio wave current meter, and Figure 1 shows a schema of its operation. When a radio wave is reflected off the surface of a river, the frequency of the reflected wave will typically change due to the Doppler effect, and the surface current velocity can be calculated based on such changes in frequency. Radio wave current meters have already been commercialized by multiple manufacturers, and used in many investigation sites.
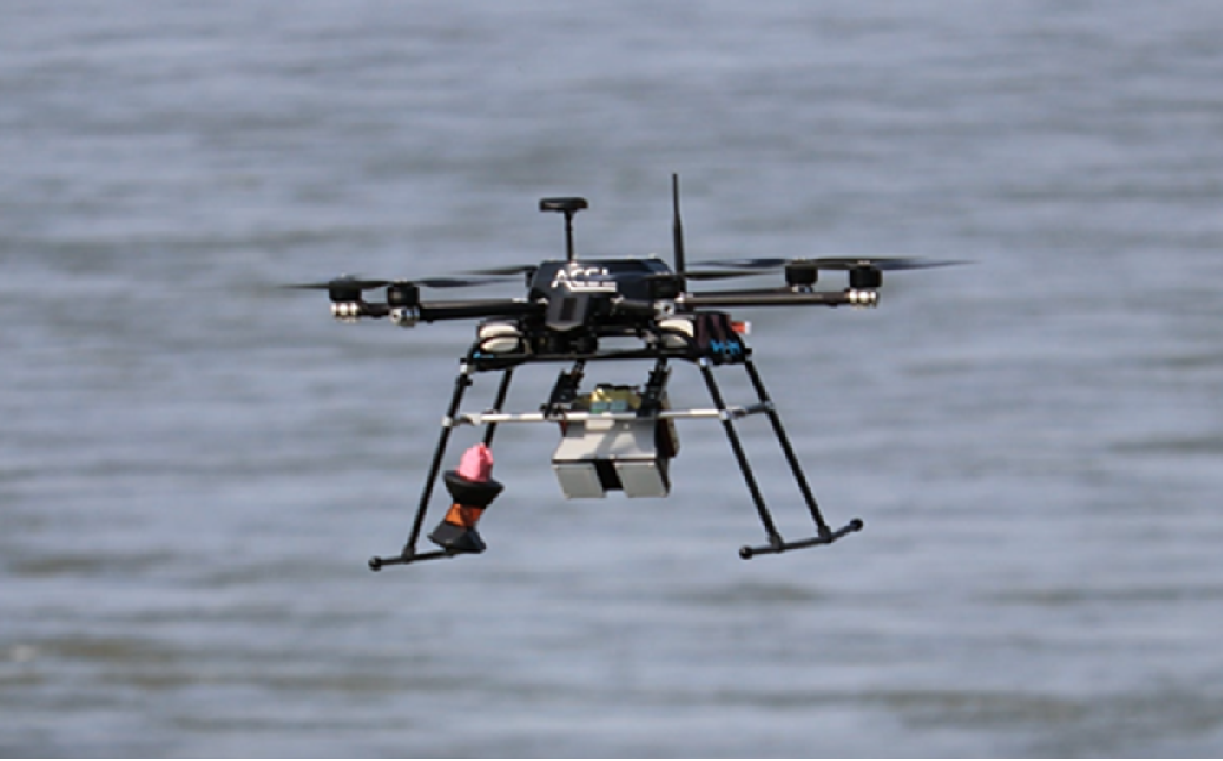
Improvements in current meters and water level indicators continue to be made by many manufacturers, in order to lower production costs and enhance accuracy. Manufacturers also seek to develop new uses and measurement methods, etc. To assist in these development activities, PWRI has held various workshops and joint water-flow observation study meetings, as the Secretariat of the Sub-committee on the Study of Advanced Technique for Observation of the Amount of Water Flow, of the Committee on Hydroscience and Hydraulic Engineering. Photo 2 shows a drone-mounted radio wave current meter in an experiment conducted at a joint water-flow observation study meeting held in April 2018.
PWRI will continue to support the research and development activities of other organizations, in addition to advancing its own.
(Contact: Hydrologic Engineering Research Team)
Extraction of Landslide Topography Using Deep Learning
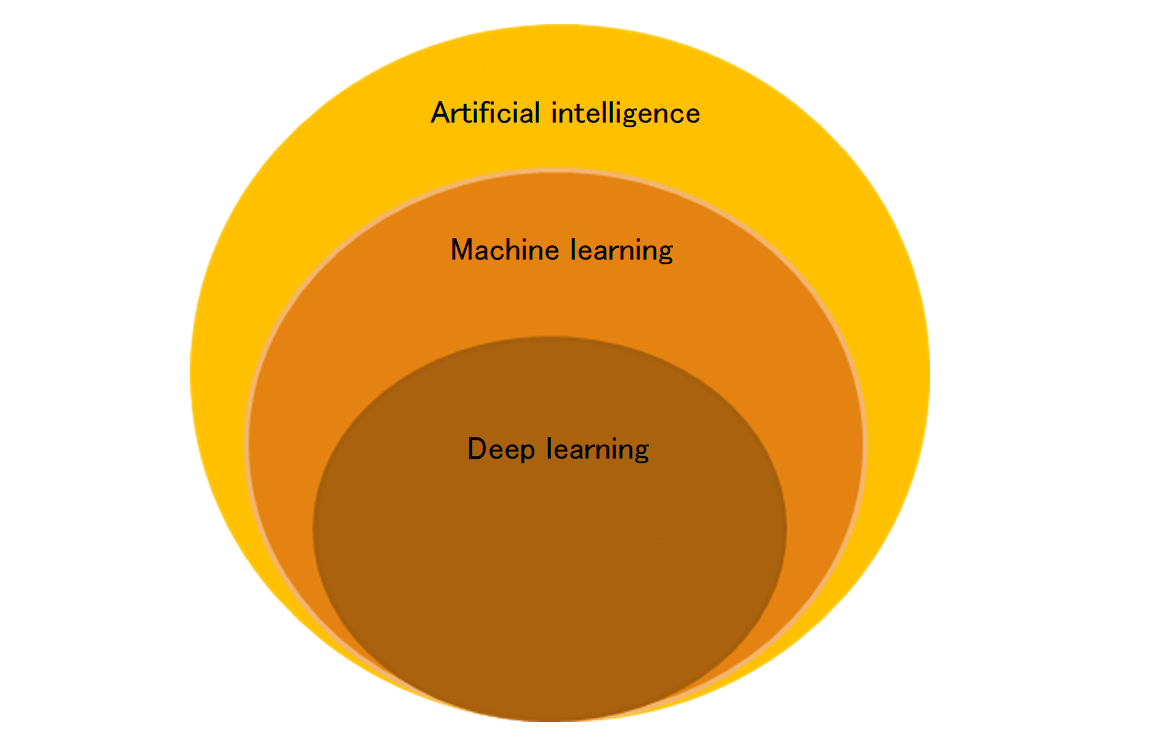
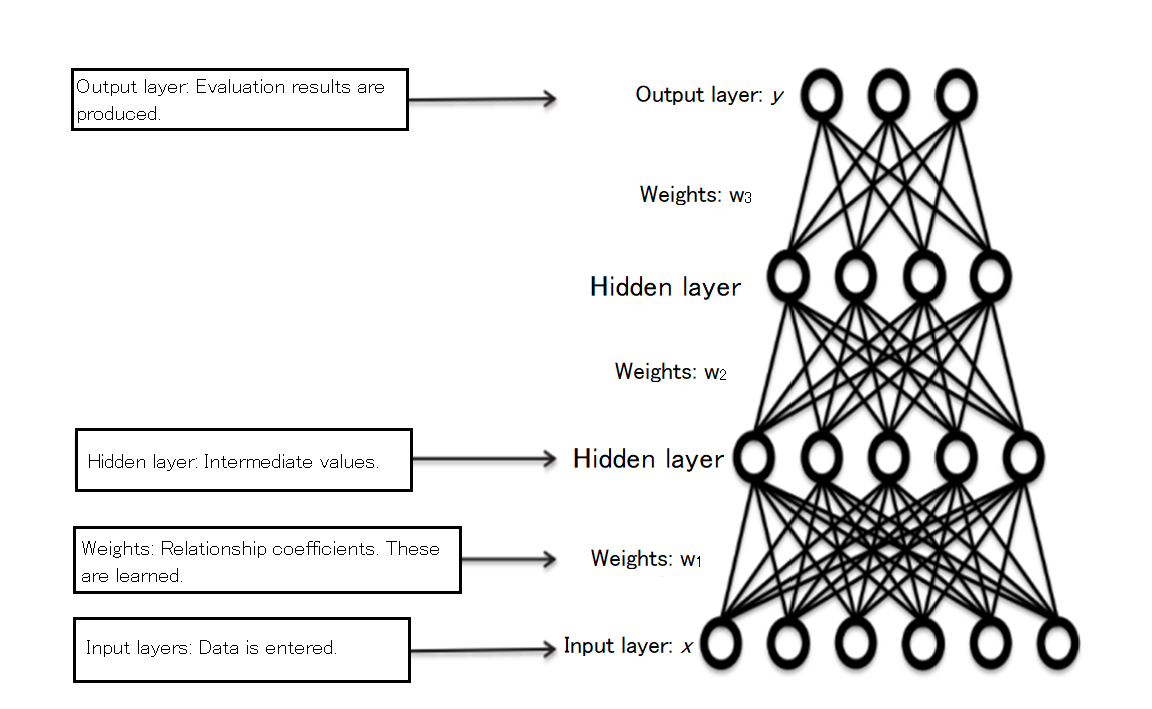
(Created by Yutaka Matsuo (2015))
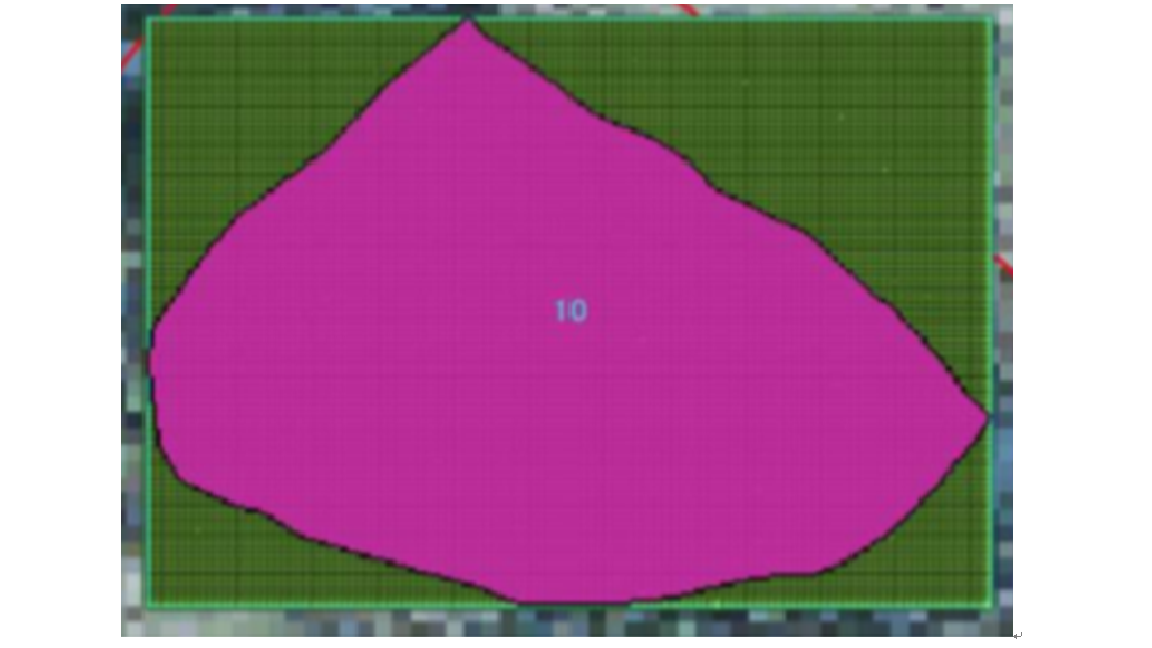
(example of learning data creation)
1.Introduction
Many landslides show patterns of recurrence and reactivation, and often reveal so-called landslide topography, which is defined by main scarps and moving bodies. Analyzing such landslide topography enables us to identify places where landslides may occur in the future.
Such analysis has traditionally been performed by engineers using topographical maps and aerial photos. In recent years, analysis even of obscure landslide topography has become possible using topographical maps created from high-precision data obtained by airborne laser scanning. However, such analysis takes considerable time if the target range covers a wide area.
Thus, we have been examining the possibility of automatic extraction of landscape topography using deep learning, with the aim of improving work efficiency.
2. Deep learning
Deep learning refers to a computer-based machine learning method (Figure 1) which aims to achieve more accurate and efficient determinations by enabling the computer to grasp feature quantity, such as the potential regularity of data, using neural network models (Figure 2) based on the mechanism of the human brain.
3. Extraction of landslide topography using deep learning
When automatically extracting landslide topography using deep learning, a computer acquires the data of many types of landslide topography by recognizing them as image data (Figure 3). Specifically, we first sort out the contour maps, slope maps, and altitude maps, which have been created based on the existing landslide topography data and airborne laser scanning results, into test data and training data (including validation data), and input the test data into the neural network. Next, we adjust the parameters of the neural network to bring the results predicted by the computer closer to the true values (actual landslide topography). Finally, over the range defined by the test data, we extract the landslide topography using the models learned by the computer, and compare it with the test data to check the versatility (Figure 4).
Currently, together with four private companies, PWRI is attempting to extract landslide topography under various conditions with different landslide topography data, geomorphic quantity data, and network structures.
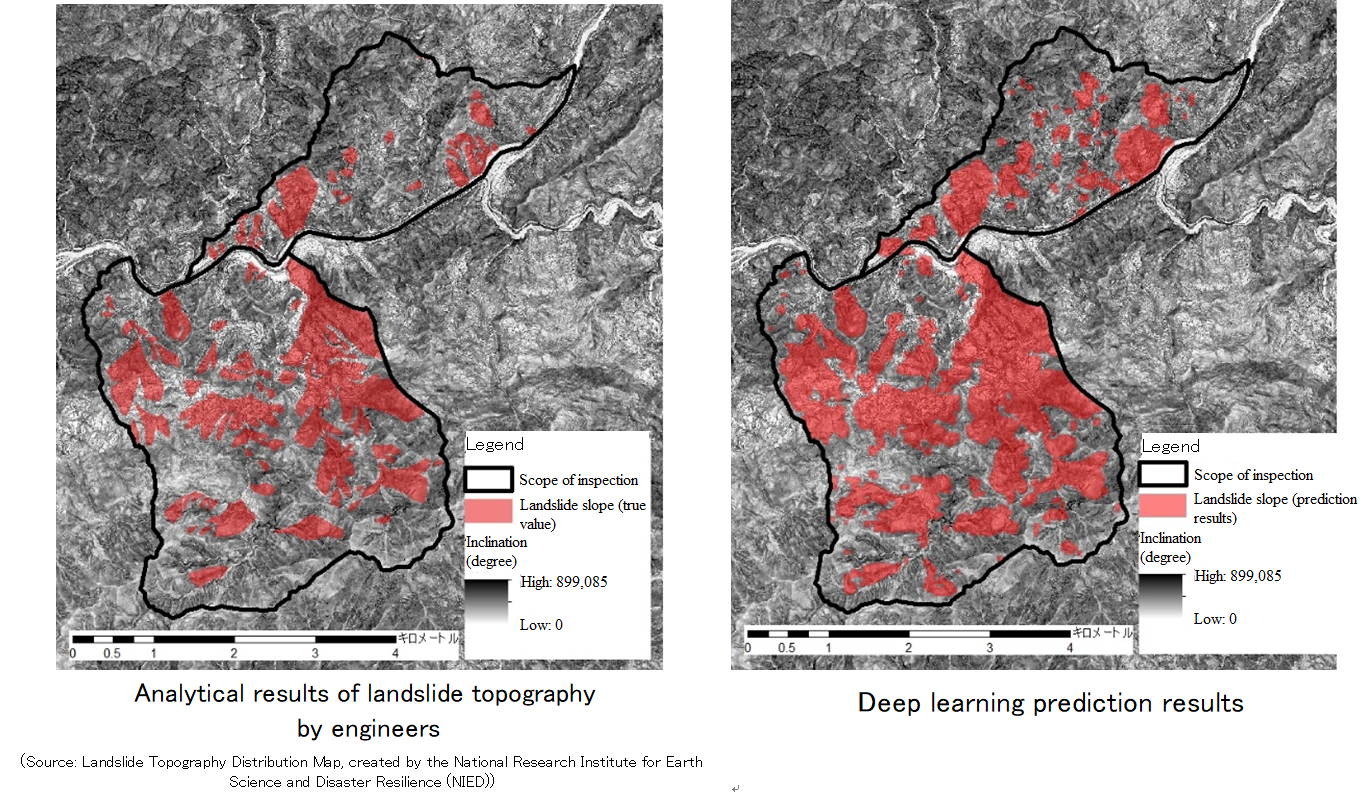
Figure 4. Comparison of analytical results based on the Landslide Topography Distribution Map
(created by NIED) and deep learning prediction results
(Contact: Landslide Research Team)
Oceanic Environment of Northern Japan Sea around Musashi Bank and Upwelling Effects of Mound Reef
1. Objectives
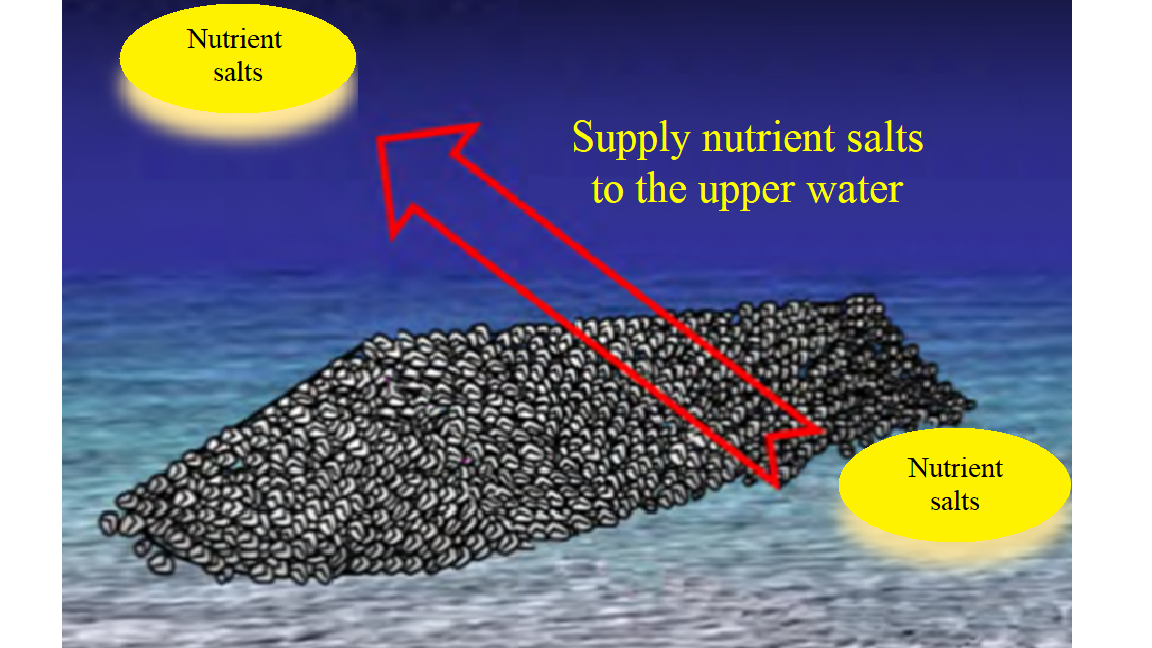
In recent years, Japan's fisheries output has decreased to 40% of the peak. In the surrounding waters of Hokkaido, the population of the Alaska pollock stock in the north Japan Sea has been significantly decreasing. A project aiming to develop the forceful fishing ground using a mound reef (the Frontier Fishing Ground Development Project) is ongoing in the west Japan Sea. Our research team is carrying out the basic research to elucidate the impact of fishing ground development in the northern Japan Sea(Figure 1).
Through field observations and simulations using a numerical model, this study examined the effect of a mound reef established in the northern Japan Sea if the mound reef could bring the nutrient salts in the bottom water to the upper water.
2. Structure of Primary Production and Effects of Mound Reef
In the northern Japan Sea, in which this study took place, thermoclines are observed from summer to autumn due to the increased surface water temperature. During this season, the primary production become low due to the scarcity of nutrient salts in the photic zone. On the contrary, nutrient salts are fully supplied through the vertical mixing of water in winter, but the low solar radiation amount limits the primary production. The highest level of primary production is always observed in spring, responding to sufficient nutrient salts and solar radiation in the area.
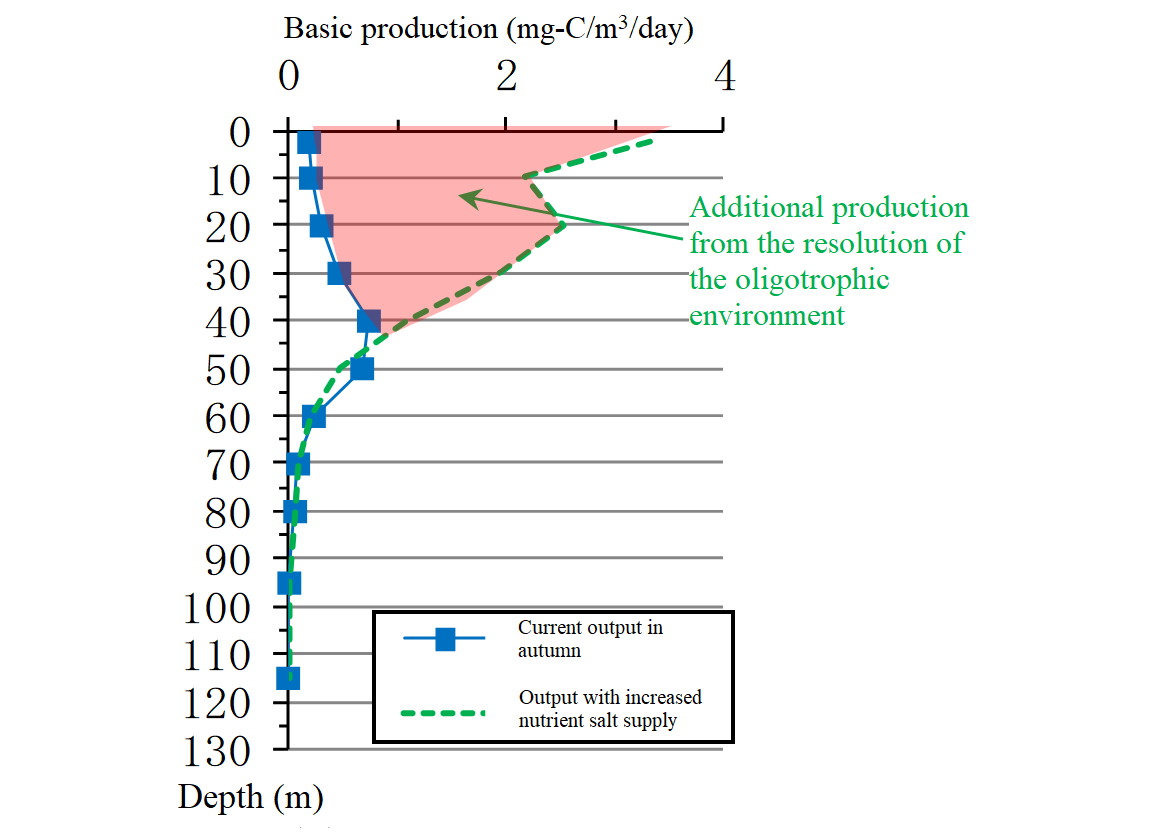
According to the above knowledge, it may be possible to increase the primary production by supplying nutrient salts in the bottom water to the upper photic zone from summer to autumn. In a simulation using a lower trophic ecosystem model, it demonstrated that the primary production almost triples the current output if nutrient salts are supplied in autumn, during which nutrient salts are conventionally scarce (Figure 2).
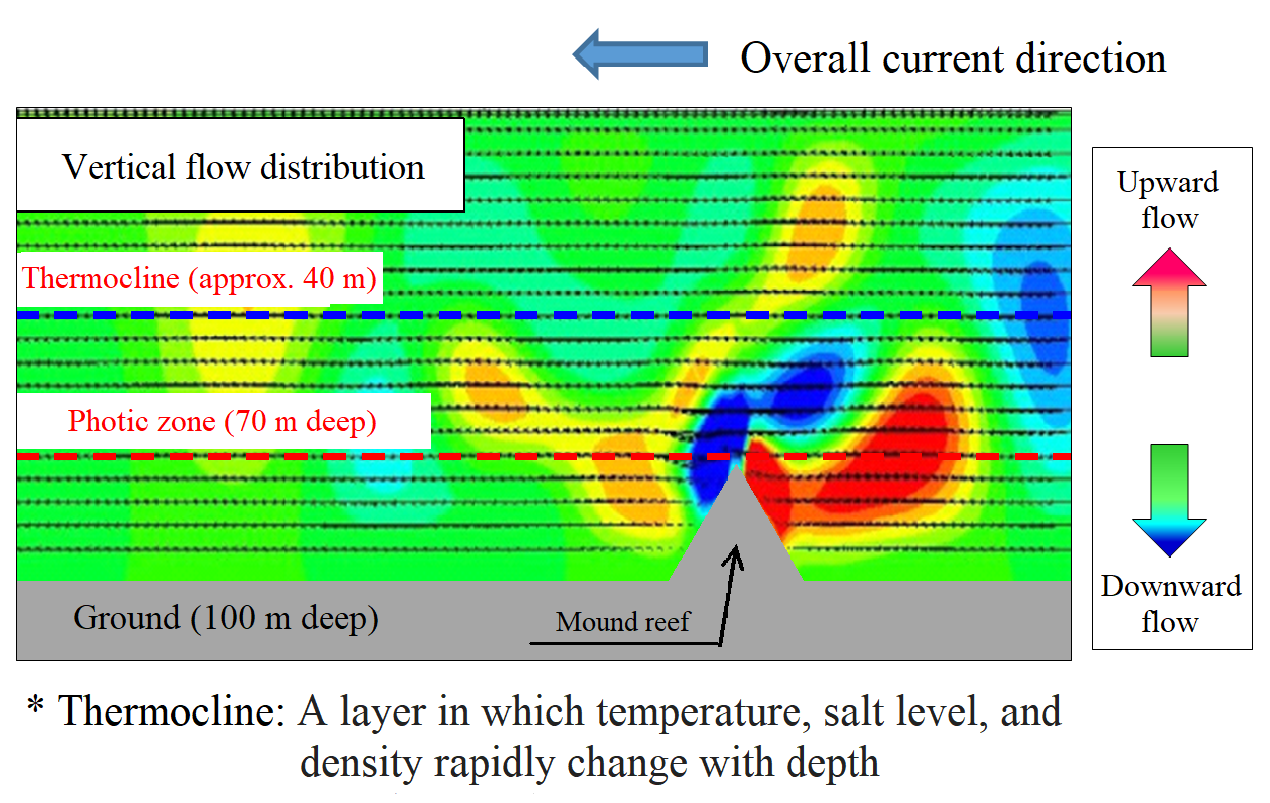
With a numerical model, vertical flow distribution was analyzed assuming that a mound reef (of 30 m high) is established at a depth of 100 m, where the current velocity is 20 cm/s. As a result, seawater mixing was observed among layers, including those above the thermocline at 40 m deep, confirming the upwelling effect of the mound reef under those conditions (Figure 3).
 |
 |
with the numerical model |
(Contact: Fisheries Engineering Research Team, CERI)

